Marginal ROAS Matters More Than Past Channel ROAS
Learn how marginal ROAS differs from average and incremental ROAS and why it matters for cross-channel budget allocation.
Marginal ROAS Matters More Than Past Channel ROAS
Marginal return on ad spend (ROAS) tells you the return on your next dollar of ad spend. Ad spend is the money you pay for advertising. Marginal ROAS does not tell you the return on past dollars. Your average ROAS often exceeds this number.
Most channels give lower returns as spend grows. If you rank channels by average ROAS alone, you can add money to a full channel. You can also take money from a channel that still has room to grow.
Definition and Formula
Marginal ROAS, or mROAS, measures the extra revenue you get from one extra unit of ad spend. The formula is simple:
Marginal ROAS = Change in Revenue / Change in Ad Spend
To calculate it, compare revenue at your current spend level with revenue at a slightly higher spend level. Then divide the difference in revenue by the difference in spend. One method raises spend by a small amount, often one percent. It then measures the extra revenue over the extra spend. This approach appears in the mmm_stan documentation cited by smartsmssolutions.com.
Marginal ROAS differs from average ROAS. Average ROAS divides total revenue by total spend across the full period. It shows how a channel performed overall. It does not show what happens when you spend more. As one analysis states, average return on investment (ROI) is an average across the modeled window. It tells you almost nothing about the next dollar, according to QRY's MMM glossary.
Average vs Marginal vs Incremental ROAS
These three terms sound similar. Each term answers a different question.
- Average ROAS answers: How did this channel perform overall, across all spend?
- Marginal ROAS answers: What will the next dollar of spend return?
- Incremental ROAS answers: What extra revenue came from a specific block of new spend, measured against a baseline?
Marginal ROAS is a limit case of incremental ROAS. It looks at a very small increase in spend. It measures the return at that point on the curve, per Recast's explanation of average versus marginal ROI. Incremental ROAS can cover a larger block of spend, such as a new $50,000 campaign. It compares outcomes with and without that spend.
Here is a worked hypothetical example. Assume Channel A has an average ROAS of 5.0. Its marginal ROAS at current spend is only 1.5. Channel B has a lower average ROAS of 3.0, but its marginal ROAS is 3.5. If you have $10,000 to add to your budget, Channel B is the better choice.
This choice holds true even though Channel B has a lower average ROAS. Formula's guide to marginal ROAS uses this example.
This distinction connects to three different evidence methods. Attribution models assign credit to touchpoints based on rules or algorithms. Incrementality tests, such as geo holdouts or lift studies, measure the true effect of spend by comparing test and control groups. Marketing mix modeling, or MMM, estimates the statistical relationship between spend and outcomes across time, using response curves. Marginal ROAS can come from any of these methods. MMM is the most common source, because it models the full curve of falling returns across a spend range.
Reading Response Curves
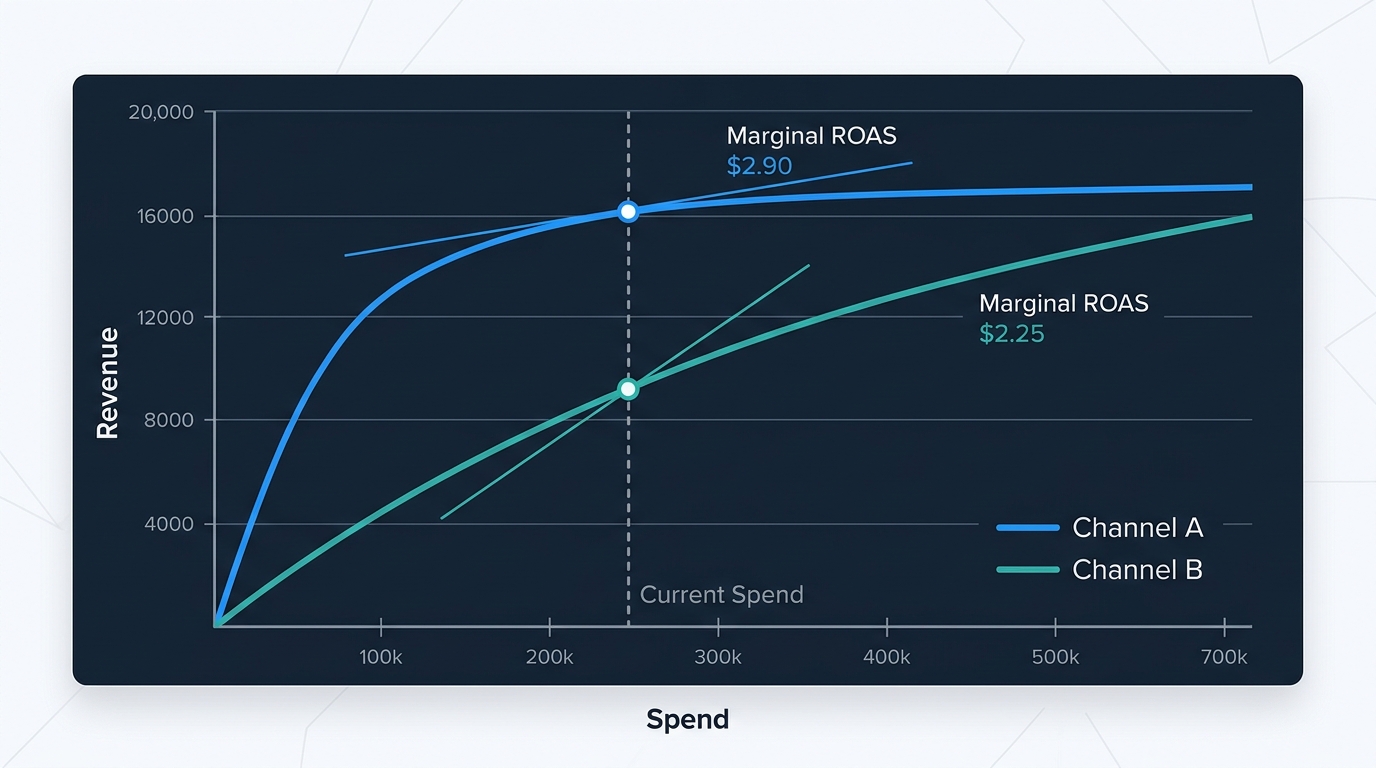
A response curve plots revenue against spend for a single channel. Most channels follow an S-shaped or curved-down line. Early spend often shows strong returns. As spend grows, returns become more even, then flatten into a plateau, according to mbuzz's breakdown of diminishing returns.
Marginal ROAS is the slope of the tangent line at your current spend point on this curve. A tangent line touches the curve at one point without crossing it. To find the slope, compare your current spend and revenue point with the point one unit higher. Then calculate the slope between those two points. This method comes from Precis's guide to marginal ROAS.
A steep tangent means a high marginal return. A flat tangent means the channel is near its limit.
You can compare two channels this way. One channel may have a higher average ROI but a flatter curve at its current spend point. This condition means the channel is closer to its limit. Another channel may have a lower average ROI but a steeper curve. This condition means the channel still has room to grow, an example described by Sellforte's guide to advertising response curves.
Accurate response curves need changes to raw spend data. One key step is the adstock transformation. It accounts for the delayed and carryover effect of ads over time. Our guide to adstock transformation explains this step in detail.
Budget Allocation Example
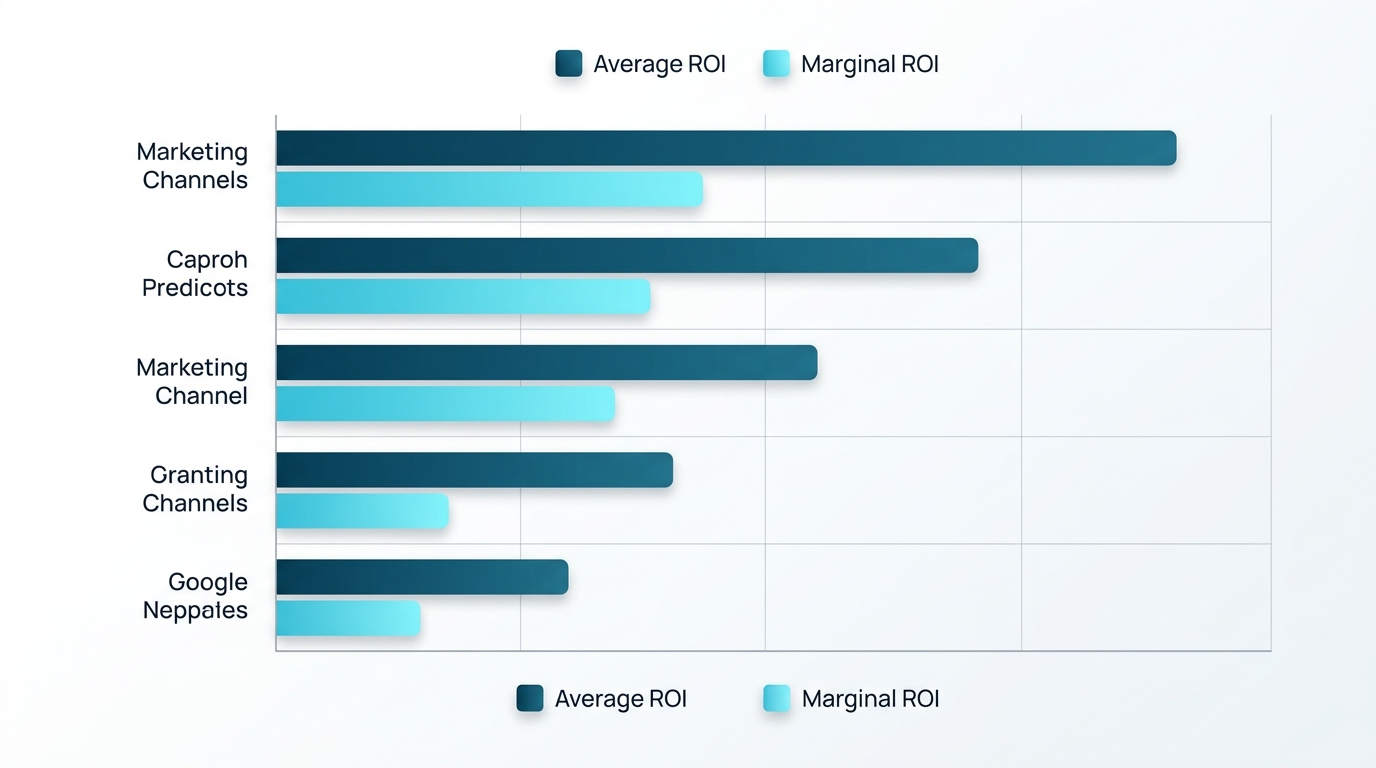
Consider a hypothetical brand with a $4 million quarterly media budget split across five channels. A model estimates the contribution, average ROI, and marginal ROI for each channel. This structure matches the model described by aiDigital's guide to media mix optimization.
| Channel | Average ROI | Marginal ROI | Interpretation |
|---|---|---|---|
| Paid Social | 4.2x | 1.1x | Strong past performance, but near saturation |
| Connected TV | 2.1x | 2.8x | Modest past performance, but room to grow |
| Paid Search | 3.0x | 2.3x | Solid on both measures |
| Out-of-Home | 1.5x | 0.9x | Weak on both measures |
| 2.5x | 2.0x | Stable, moderate room |
If you rank channels by average ROI alone, paid social appears to be the best place to add spend. If you rank by marginal ROI, connected TV is the better destination for new dollars. Its next dollar returns more.
The reallocation logic follows basic economics. A budget reaches its most efficient point when the marginal return on the last dollar is roughly equal across channels, according to aiDigital's analysis. If one channel's next dollar earns more than another channel's next dollar, you can improve total results by shifting spend. You achieve this gain at no extra cost. Keep reallocating until marginal returns are roughly equal across channels.
In this hypothetical case, you can pull money from full paid social and weak out-of-home. Then move it into connected TV and paid search. Total spend stays the same. Only the distribution changes. Our detailed media budget optimization guide walks through this reallocation process step by step.
Uncertainty and Constraints
Marginal ROAS estimates come from models, and models carry uncertainty. A response curve is only as reliable as the data behind it. Small samples or short time windows can produce unstable estimates. Trust a curve only within the observed spend range of the model. The Growth Opt Playbook on marginal efficiency provides this guidance.
Real budgets also face limits that pure math ignores. Some channels need a minimum spend to run at all. Others have a maximum capacity, such as limited ad inventory. Contracts, creative production timelines, and competitive conditions also shape what is possible. Equal marginal ROI across channels is a useful target. A team creates a real plan only when they include these limits, as the Growth Opt Playbook notes.
Average ROI and marginal ROI can also differ because of scope. Average ROI reflects results at the current spend level. Marginal ROI reflects the return on the next unit only. It usually falls below average ROI once a channel shows falling returns, according to Analytical Alley's guide to MMM ROI. For a broader view of how to read ROI figures from a model, see our marketing ROI analysis guide.
One further caution applies to profit, not just revenue. A high ROAS on paper does not always mean high profit. Under curved-down response curves, a channel with lower average ROAS can still generate more extra profit than a channel with higher average ROAS. This happens once you compare marginal returns against your break-even point. The break-even point is the spend level where cost equals revenue.
How to Use Marginal ROAS
Use marginal ROAS as your primary guide for the next spend decision, not average ROAS. Follow these steps.
- Build or review response curves for each channel, using a model that accounts for adstock and saturation.
- Calculate marginal ROI at your current spend level for each channel.
- Rank channels by marginal ROI, not average ROI.
- Shift budget from low marginal ROI channels toward high marginal ROI channels, within real limits.
- Recalculate marginal ROI after each shift. Repeat until returns are roughly equal.
- Keep average ROI in view for stakeholder reports, but base allocation decisions on marginal ROI.
Marginal ROAS does not replace judgment. It gives you a clearer signal about where your next dollar will do the most good.
Conclusion
Average ROAS tells a story about the past. Marginal ROAS tells you what to expect from your next dollar of spend. The two numbers often disagree. When they do, let marginal ROAS guide your next budget decision.
Evaluate your own channel mix using marginal returns, not past averages, before you set your next budget.

Stay in the loop
Get updates on new posts and resources.