Marketing Budget Allocation Is a Choice, Not a Formula
Allocate marketing budget across channels using goals, constraints, marginal returns, experiments, and a disciplined reallocation cadence.
Marketing budget allocation is a business choice, not a mechanical formula. Many teams copy rules such as the 70 20 10 marketing budget. That rule suggests spending 70 percent on core channels, 20 percent on emerging channels, and 10 percent on experiments. These universal rules fail because they ignore your unit economics, profit margins, and measurement quality.
A reliable framework connects corporate financial targets to the marginal returns of each channel. Marginal return is the additional profit that you gain from each extra dollar of spend.
When you plan your annual marketing budget, you must treat channel allocation as an investment problem. Capital must flow to channels that create true incremental profit. Capital must not flow to channels that claim credit through biased metrics.
You can optimize marketing spend allocation across every quarter. To do this, combine marketing mix modeling, randomized incrementality experiments, and clear operational guardrails. Marketing mix modeling is a statistical method that measures how marketing inputs drive sales. Incrementality is the measurement of true lift that marketing causes above baseline sales.
Start with business economics
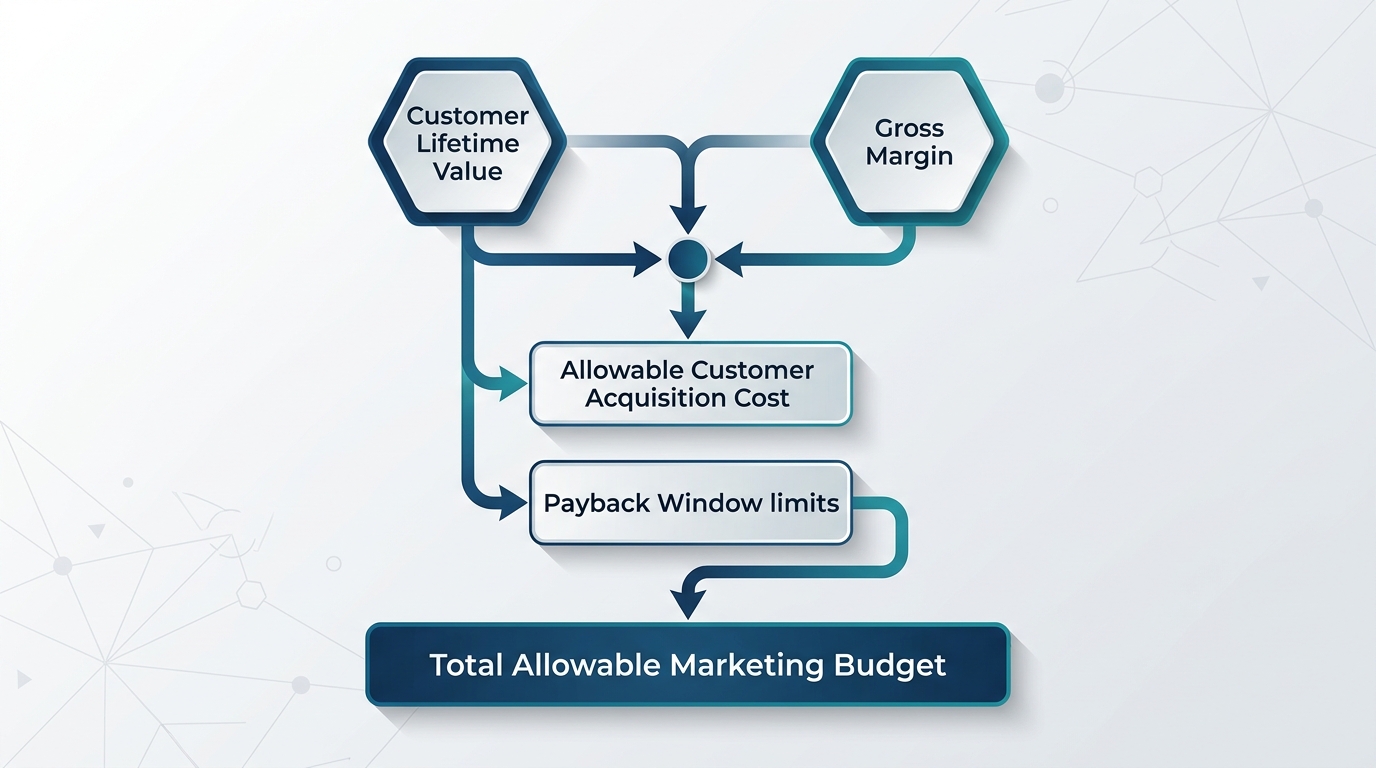
Every marketing budget must begin with corporate finance, not media channel targets. A marketing team cannot select a budget by channel until it understands company cash flow, gross margins, and payback limits.
As Grow with BA notes, first-principles allocation starts when you calculate what you can profitably spend based on your unit economics. If your business requires cash recovery within six months, you cannot fund channels that need twelve months to break even.
First, determine your allowable customer acquisition cost (CAC). Your allowable CAC depends on customer lifetime value (LTV) and your contribution margin before marketing expenses.
If a customer generates $1,000 in revenue over their life and your gross margin is 60 percent, the customer yields $600 in gross profit. If your business requires a 50 percent operating profit margin on that customer, your maximum allowable CAC is $300.
Second, connect your total budget to enterprise goals. Businesses pick one of three primary targets:
- Maximize net contribution profit within a fixed payback period.
- Maximize top-line revenue subject to a minimum profit threshold.
- Acquire new customers at or below a ceiling CAC to gain market share.
Setting these targets prevents the marketing team from spending into operating losses. It also prevents finance leaders from underfunding channels that produce net positive returns. To connect marketing strategy with corporate cash targets, read our media budget optimization guide.
Fund the base and learning agenda
Fund your fixed operational base and your experimentation reserve before you divide remaining funds across media channels. Many teams commit all media dollars to current campaigns. This mistake eliminates their ability to test new channels or confirm causal returns.
Your fixed base includes software, internal labor, agency fees, and brand assets. These costs do not scale directly with daily ad volume.
Next, reserve money for your learning agenda. Industry analyses, such as the Spendmix allocation model, recommend protecting 10 to 15 percent of your total budget for controlled experiments and new channel discovery.
Use this experimental reserve to resolve critical business questions. You can test a new advertising channel, such as connected television. You can also fund geo-lift experiments to test whether an established channel drives true incremental sales.
| Budget Layer | Typical Share | Core Purpose | Primary Success Metric |
|---|---|---|---|
| Operational Base | 10% to 20% | Creative production, martech stack, agency fees, research | Asset delivery and infrastructure uptime |
| Proven Core Media | 65% to 75% | Scaled channels with documented incremental returns | Marginal profit and incremental ROAS |
| Experimental Reserve | 10% to 15% | Geo-lift holdouts, new ad networks, novel creative formats | Statistical confidence and validated lift |
When you run experiments, you separate genuine growth from coincidental correlation. For more details on splitting budgets by customer journey stage, review our funnel-stage budget allocation guide.
Estimate channel opportunity
To allocate marketing spend correctly, you must know what each dollar actually produces. Marketers often confuse three distinct measurement approaches: attribution, incrementality testing, and marketing mix modeling (MMM). Each tool provides different evidence:
- Digital Attribution: Attribution assigns credit to touchpoints along a user click path. It often relies on last-click or rule-based models. These models show correlation, not causation. They favor channels at the bottom of the funnel, such as branded search.
- Incrementality Testing: Incrementality testing uses randomized control trials or matched-market geo holdouts. It compares a group exposed to ads against an unexposed control group. The difference in outcome is the true causal lift.
- Marketing Mix Modeling (MMM): MMM is a top-down statistical method. It uses aggregate historical sales, media spend, pricing, and economic data. It estimates how each marketing channel drives baseline sales and incremental revenue over time.
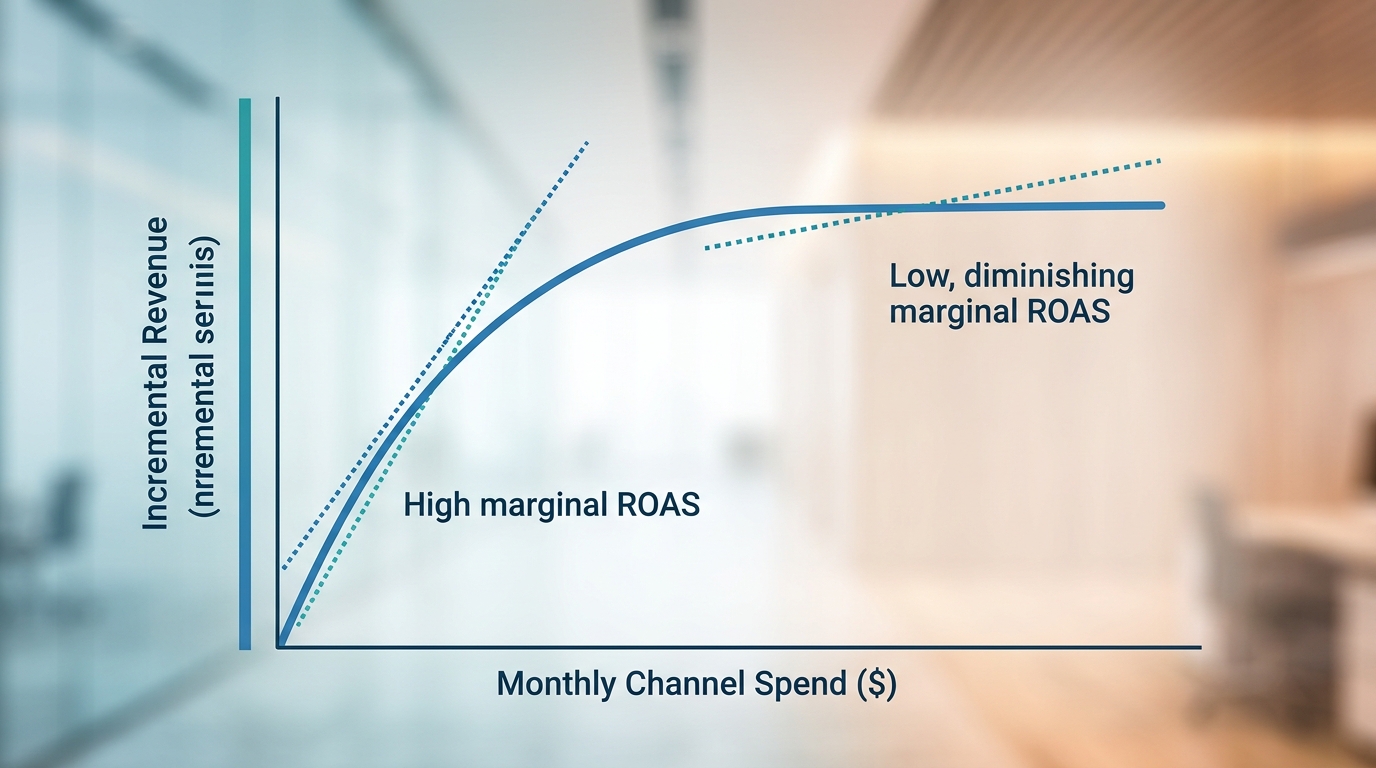
Do not allocate funds based on average return on ad spend (ROAS). ROAS is the ratio of total revenue to total advertising spend. Average ROAS hides diminishing marginal returns. A channel can produce an average ROAS of 4.0, but the next $10,000 spent might yield an incremental return of only 0.8.
As researchers at WorkMagic show, saturation curves reveal that marginal returns drop as spend scales, even when average ROAS looks strong. You must allocate based on marginal return on ad spend (mROAS).
mROAS = (Change in Incremental Revenue) / (Change in Media Spend)
To see mathematical examples of diminishing returns, read our deep dive on marginal ROAS. If you put new money into saturated channels, you waste capital. You should reallocate marketing spend toward channels that operate below their point of diminishing returns.
Set constraints
Unconstrained mathematical models can produce dangerous allocation recommendations. An optimizer can tell you to invest 90 percent of your budget into one channel because its current marginal return is high. Real-world business operations require practical boundaries.
Set clear minimum floor spend levels and maximum ceiling spend levels for each channel. As noted by Spendmix, modern ad platforms need a minimum floor spend. Automated bidding algorithms need that spend to gather sufficient conversion data to train correctly. If you fund a channel below its learning threshold, performance degrades.
Conversely, set spend ceilings based on market audience size and inventory limits. If your target demographic is small, pushing spend past a certain limit creates creative fatigue. Ad frequency will rise and prospective buyers will ignore your ads.
You must also establish liquidity constraints. Some channels require upfront quarterly commitments or minimum spend contracts. Other auction platforms allow you to adjust budgets daily. Document these operational rules before you distribute your funds. You can find more detail in Model Reef's guide on role-based allocation and governance rules.
Hypothetical Channel Constraints Table:
- Paid Search: Floor = $20,000/month; Ceiling = $80,000/month; Flexibility = Daily
- Paid Social: Floor = $15,000/month; Ceiling = $60,000/month; Flexibility = Daily
- Connected TV: Floor = $25,000/month; Ceiling = $50,000/month; Flexibility = Monthly
- Affiliate: Floor = $5,000/month; Ceiling = $30,000/month; Flexibility = Weekly
Allocate and pace
Once you establish your constraints and marginal response curves, you can calculate the optimal channel mix. Use an equalization approach. Direct the next marketing dollar to the channel with the highest expected marginal contribution profit.
As you increase spend in that channel, its marginal return declines. When its marginal return equals the marginal return of another channel, divide next dollars across both channels.
Consider this hypothetical worked example. A direct-to-consumer retailer has a $100,000 monthly media budget across three channels: Paid Search, Paid Social, and Streaming Video.
Hypothetical Marginal ROAS Profile:
Channel           Spend Level     Average ROAS     Marginal ROAS
Paid Search       $30,000         3.5x             1.2x (near saturation)
Paid Social       $40,000         2.8x             1.9x (room to scale)
Streaming Video   $15,000         2.0x             1.8x (room to scale)
Testing Reserve   $15,000         N/A              N/A (holdouts/tests)
In this scenario, traditional last-click reporting tells the marketer to give more budget to Paid Search because its average ROAS is 3.5x. However, the marginal ROAS of Paid Search is only 1.2x. Meanwhile, Paid Social delivers a marginal return of 1.9x on the next dollar. The disciplined marketer holds or reduces Paid Search spend and moves incremental capital into Paid Social until the marginal returns equalize.
Next, pace your investments according to sales cycles and operational calendar reality. Do not split an annual marketing budget into twelve equal monthly pieces. Align your budget pacing with historical demand patterns, seasonal customer interest, and commercial shipping deadlines.
Review and reallocate
Marketing budget allocation is not a static annual event. It requires regular operational reviews to match changing market conditions. Competitor bidding, ad inventory costs, and platform algorithm changes constantly alter channel response curves.
Establish a structured review cadence. Review platform delivery and technical health weekly to ensure campaigns pace within spend guardrails.
Conduct strategic budget reallocation reviews monthly or quarterly. As the Phenyx marketing budget guide advises, run holdout or incrementality tests on your top channels at least twice a year. These tests validate your baseline assumptions.
Use explicit decision rules to trigger capital movement. For example:
- If an incrementality test reveals an incremental ROAS below 1.0, reduce that channel spend by 20 percent. Reallocate those funds to the experimental testing reserve.
- If a channel exhibits creative fatigue and its marginal CAC rises above your economic ceiling for three straight weeks, pause that creative set. You can also lower the channel spend ceiling.
- If an emerging channel delivers statistically significant incremental lift in two consecutive tests, graduate it from the testing reserve into the core media mix.
When you calibrate your econometric models with verified test results, your budget becomes resilient. You rely on reproducible evidence rather than subjective opinions.
Build your evidence-based allocation plan
Universal allocation formulas offer false comfort. Copying fixed budget benchmarks will not protect your margins or guarantee commercial growth. Sound marketing budget allocation requires economic discipline, robust statistical modeling, and ongoing incrementality validation.
We invite you to examine your media performance through an evidence-based lens. Contact our measurement team today for an evidence-based allocation assessment. We help you locate diminishing returns and increase the incremental yield of your marketing investments.
Stay in the loop
Get updates on new posts and resources.