Marketing Budget Optimization Software Needs More Than a Dashboard
Learn how marketing budget optimization software works and compare tools by response curves, constraints, scenarios, and workflow fit.
Marketing budget optimization software helps a team make spend choices. The software shows where to spend the next dollar. It does not only show where the past dollar went.
A true budget optimizer combines two elements. It uses a measurement model and a mathematical solver. The solver finds the best split of spend across marketing channels under real limits.
A dashboard that ranks channels by return on ad spend (ROAS) is a different tool. ROAS is the revenue that marketing spend generates divided by that spend. A dashboard shows past data. It does not predict future results.
This article explains what these tools do and how they optimize spend. It details the required data and compares software tiers. It also shows common failure modes and gives a buying checklist.
What Budget Optimizers Do
A budget optimizer answers a core planning question. It shows how to split a fixed budget across channels to get the best result. The result can be revenue, sales orders, or business leads. Some tools also answer a sizing question: should you raise or lower the total budget?
To answer these questions, the software needs three components:
- An estimate of how each channel contributes to the outcome.
- A response curve that shows how contribution changes when spend changes.
- A mathematical solver that sets spend levels across all channels at once.
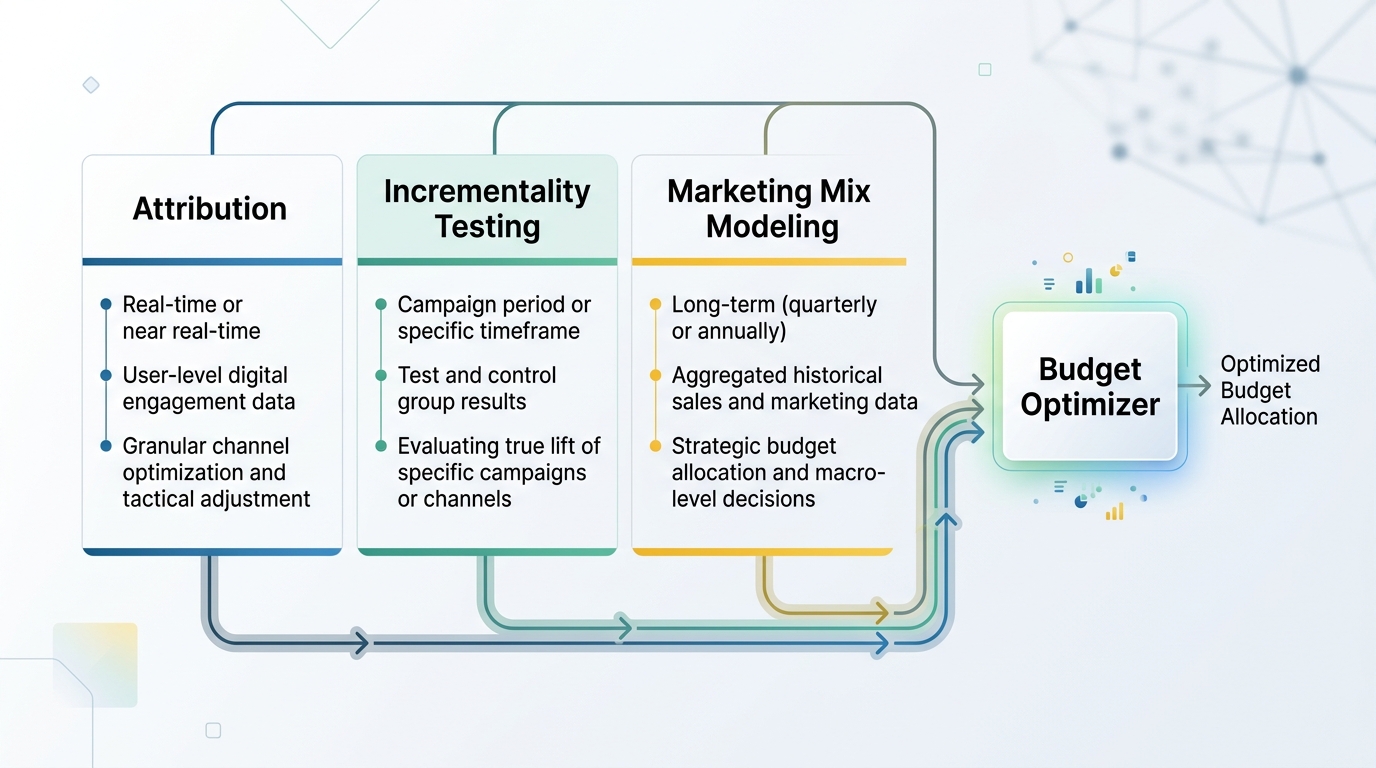
This method differs from attribution. Attribution tracks the click paths of individual users.
This method also differs from incrementality testing. Incrementality testing measures sales lift through controlled experiments.
Marketing mix modeling (MMM) is a statistical method. It uses past spend and outcome data to estimate channel contributions over time.
Good optimizers sit on top of an MMM. The model includes offline channels and long-term effects that user attribution cannot track. An aidigital.com breakdown of MMM outputs explains this method.
Optimization Methods
Software tools use different methods to solve spend problems. Three methods are common, and they produce different answers.
Rule-based allocation. The tool applies fixed rules. For example, it keeps spend equal to the past quarter. It can also cap each channel at 30 percent of the budget. This method is simple, but it ignores diminishing returns.
Average-ROI ranking. The tool ranks channels by past return on investment. Then it shifts money to the top channels. This method can fail. The average return does not equal the marginal return.
Marginal, constrained optimization. The tool fits a response curve for each channel. This curve accounts for carryover effects, which analysts call adstock. Our guide to adstock transformation covers this process.
The curve also accounts for diminishing returns, which analysts call saturation. Saturation occurs when more spend produces smaller gains.
The tool then solves a math problem with limits. It maximizes the predicted result subject to a total budget limit and per-channel minimums or maximums.
Rigorous tools use this method. The optimizer balances channels until the marginal return of the last dollar is equal everywhere. A technical walkthrough of response curves and constrained budgets details this concept.
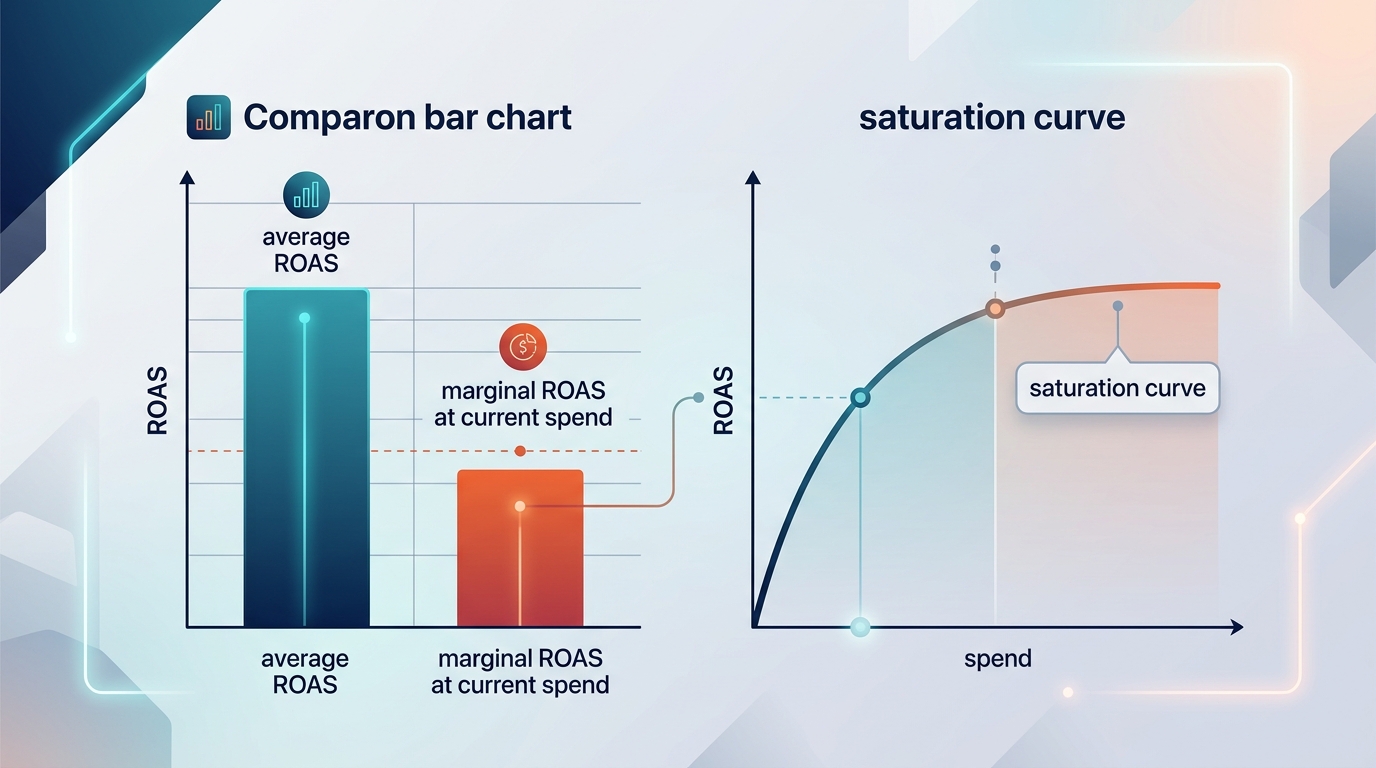
This third method separates true optimization software from a simple ranking. Marginal ROAS is the return on the next dollar spent. Average ROAS is the return across all dollars spent.
A channel can show high average ROAS and low marginal ROAS at the same time. This pattern happens when the channel operates near its saturation point.
Worked example (hypothetical). Assume a five-channel budget of $500,000 each month. Search has an average ROAS of 4.0. Search has a marginal ROAS of 1.2 because it already receives heavy funding.
Display has an average ROAS of 2.0. Display has a marginal ROAS of 2.5 because it lacks funding.
A marginal-return optimizer shifts money from search to display until their marginal returns match. A dashboard sorted by average ROAS would suggest the opposite change.
Required Inputs
A budget optimizer depends on the data behind its response curves. Most credible tools require the same basic inputs. Exact data minimums vary by vendor.
| Input | Typical Minimum | Why It Matters |
|---|---|---|
| Historical spend by channel | 52 weeks, 104+ preferred | Less than a year misses seasonal cycles |
| Impressions or reach by channel | Same window as spend | Spend alone misses adstock effects |
| Outcome metric (revenue, orders, leads) | Weekly, same period | Should match the metric your finance team tracks |
| Promotion and discount flags | Every promotion week | Prevents crediting marketing for a sale event |
| Seasonality markers | Weekly index or dummy variables | Prevents over-crediting a channel scaled during a peak season |
| Price changes | Any shift flagged | Removes confounding from price elasticity |
| External controls | Optional | Economic or search-trend indexes improve stability |
This input list follows guidance from measurement specialists. Relevant sources include ObserviX's overview of MMM inputs and the minimum data table in AdLibrary's MMM practitioner playbook. Our media budget optimization guide also explains how to prepare this data before the first model run.
Weak or short data does not generate an error message. It generates an incorrect answer that looks precise. You must review data quality as carefully as you review the software interface.
Feature Comparison
Software vendors describe their tools in different ways. Most budget optimizers fit into one of three tiers. Exact features vary by vendor and pricing plan.
Verify vendor claims against current documentation, because products change over time. This comparison reflects broad market categories at the time of writing. It does not rank specific products.
| Tier | Core Method | Typical Output | Best Fit |
|---|---|---|---|
| Dashboard/reporting | Historical ROAS by channel | Ranked channel list | Quick reviews, not reallocation decisions |
| Rule-based allocator | Fixed formulas or caps | Suggested percentage splits | Simple portfolios, low data maturity |
| Model-based optimizer | MMM plus constrained solver | Optimal spend mix, scenario outputs | Multi-channel budgets, quarterly planning |
BlueAlpha.ai's measurement platform is one managed option in the model-based category. Teams should verify its response-curve methods, constraints, scenario controls, data requirements, and export terms directly. Apply the same review to every product under consideration.
Model-based tools provide scenario planning features. These features let a planner test a budget change before spending capital.
A simulation shows projected revenue under current and proposed plans. This forecast helps you build a strong case for finance leaders. A discussion on aidigital.com's discussion of scenario planning confirms this point.
Constraints and Failure Modes
A budget optimizer operates under real constraints. Models also create risk of error. You must check both factors before you trust the output.
Business constraints. Media contracts often set spend floors. Ad platforms require a minimum spend to finish learning phases.
Creative production limits can also restrict channel scale. A good optimizer lets you set spend minimums and maximums rather than forcing an abstract mathematical answer.
Multicollinearity. Marketing channels often shift together. For example, multiple campaigns scale up during the same holiday.
This shift makes it hard to separate the true effect of each channel. Lifesight's guide to marketing mix modeling discusses this known model limitation.
Silent model failure. A model can fit past data well and still fail to predict the future. Model validation is as important as optimization.
Our guide to validating an MMM explains holdout testing and stability checks. These checks confirm model accuracy before you make budget decisions.
Overconfidence in point estimates. Every software output is a forecast, not a guarantee. You must test scenario plans against worse results before your team commits money to a reallocation.
Buying Checklist
Confirm the following points with the vendor before you buy marketing budget software. Ask for technical proof instead of marketing claims:
- Does the tool fit a response curve for each channel, or does it rank by average ROAS alone?
- Does the solver handle per-channel floors, caps, and total budget limits at the same time?
- Can the tool simulate scenarios, such as a 15 percent cut or increase, before you commit spend?
- Does the vendor explain its adstock and saturation methods clearly?
- Does the tool support holdout validation to test predictions against unseen data?
- Does the vendor state minimum data requirements, including history length and time increments?
- Does the tool treat attribution, incrementality, and MMM as separate evidence sources?
- Can you export model assumptions and coefficients for internal review?
A vendor that cannot answer these questions clearly might sell a dashboard rather than an optimizer.
Conclusion
A cross-channel budget optimizer combines a measurement model and a mathematical solver. The software estimates the marginal return of the next dollar. It does not just show the average return of past spend.
The optimizer differs from attribution and incrementality tests because it evaluates the complete marketing portfolio. It uses MMM to measure long-term and offline effects that user tracking cannot record.
No single output settles a budget decision alone. Contribution estimates, marginal returns, and scenario simulations each answer part of the question. A sound buying decision tests the vendor method against your data before you trust its numbers.
MediaMixModel.com offers a model-readiness assessment. We evaluate whether your data and models support marginal allocation.
Our team reviews your data inputs and model validation history. Then we show you how to move from your current setup to practical budget guidance.

Before you buy another planning tool, connect with an MMM consultant to review your data and budget process. You'll get a practical view of whether MMM can support the allocation decisions your team needs to make.
Stay in the loop
Get updates on new posts and resources.