How to Validate and Interpret Marketing Mix Model Results
Don't fly blind. Learn how to validate MMM results using statistical checks, holdout testing, and business logic. Start validating your marketing data today.

You have just spent weeks gathering data. You cleaned it. You processed it. You finally ran your Media Mix Model (MMM). The dashboard lights up with numbers, charts, and ROI figures.
Now comes the terrifying question: Is this actually true?
A model is just a mathematical approximation of reality. It is not reality itself. If you blindly follow a flawed model, you will burn budget faster than you can say "customer acquisition cost."
You need to know how to validate MMM outputs before you bet your job on them.
This isn't just about checking if the math "works." It’s about ensuring the marketing mix modeling results align with business logic and predictive reality. Here is how you strip away the complexity and judge the quality of your marketing measurement.
The Three Pillars of MMM Validation
Validation isn't a single step. It is a tripod. If one leg breaks, the whole thing falls over.
- Statistical Fit: Does the math explain the historical data?
- Predictive Accuracy: Can the model predict data it hasn't seen yet?
- Business Logic: Do the results make sense in the real world?
Let’s break these down.
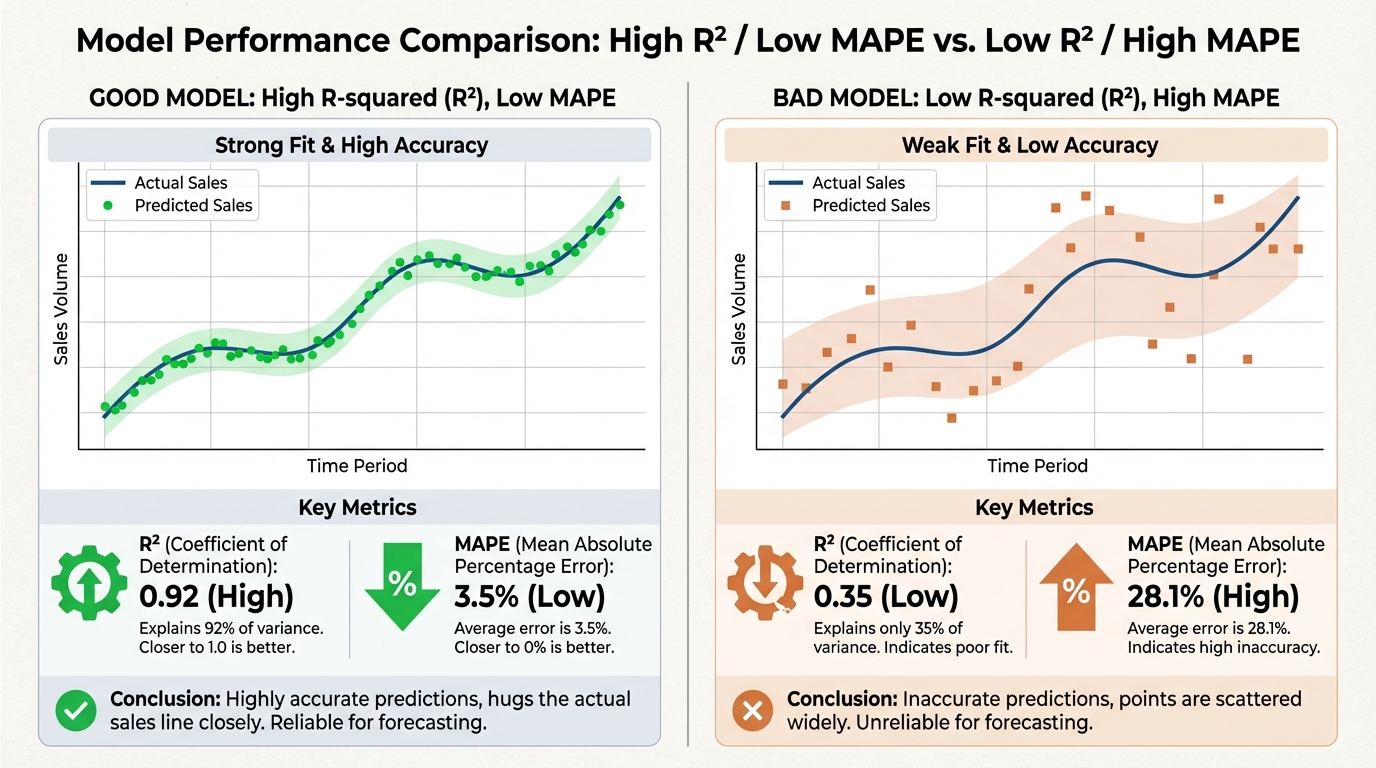
1. Statistical Health Checks: R-Squared and MAPE
You don't need a PhD in statistics to spot a bad model. You just need to know which metrics matter. When you look at your marketing effectiveness measurement guide, you are looking for specific indicators of health.
R-Squared (R²)
This is the most common metric in regression analysis. It tells you how well your model’s trend line matches your actual sales data. According to Investopedia, R-squared represents the proportion of the variance for a dependent variable that's explained by an independent variable.
- 0.0: Your model explains nothing.
- 1.0: Your model explains everything perfectly (which is suspicious).
The Sweet Spot: Look for an R-squared between 0.80 and 0.95. If you see 0.99, your model is likely "overfitting." This means it memorized the past data but won't be able to predict the future. Overfitting is the silent killer of data science projects; it looks great in the lab but fails in the market.
MAPE (Mean Absolute Percentage Error)
R-squared is abstract. MAPE is concrete. It tells you, on average, how wrong the model is in percentage terms. Leading forecasters and statisticians often cite MAPE as a critical measure for demand planning accuracy.
- If your actual sales were $100 and the model predicted $90, your error is 10%.
- Target: A MAPE below 10% is excellent. Below 5% is world-class. Anything above 20% means your model is guessing.
!Comparison of good vs bad statistical fit in marketing mix modeling.*
According to a report by Gartner, over 60% of marketing models fail to drive action because stakeholders don't trust the underlying accuracy. Don't be that statistic.
2. Holdout Testing: The Gold Standard
Statistical fit on historical data is easy. Predicting the future is hard.
The gold standard to validate MMM is holdout testing. This is non-negotiable. If a vendor shows you a model without a holdout test, they are showing you a history book, not a prediction engine.
Here is how holdout testing works:
- Take your 2 years of data (training set).
- Hide the last 3 months from the model (test set).
- Train the model only on the first 21 months.
- Ask the model to predict the sales for those hidden 3 months.
If the model predicts the hidden months accurately, you have a winner. If the prediction line goes up while actual sales went down, your model is broken.
This is a core component of any robust media mix model marketing attribution guide. If your data scientist refuses to show you holdout testing results, run.
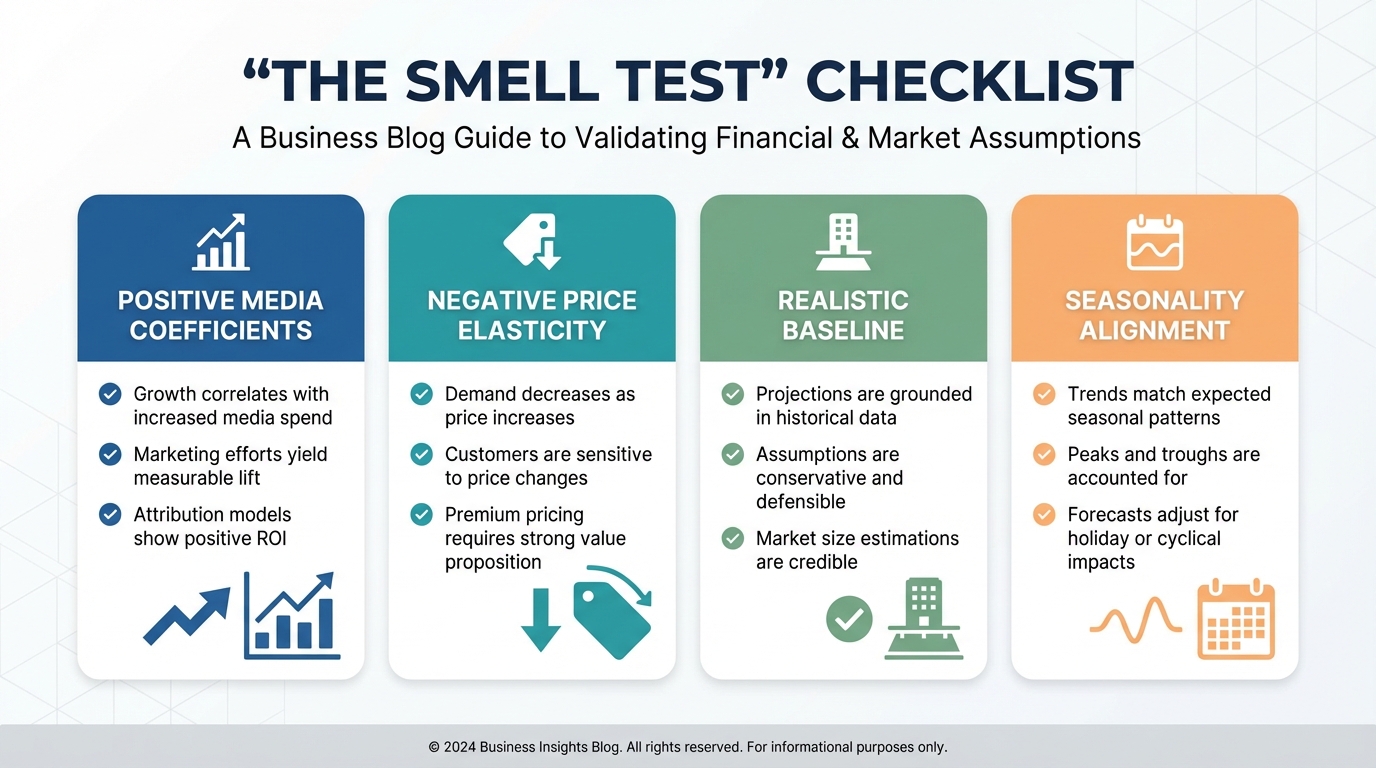
3. The "Smell Test" (Business Logic)
Algorithms are smart, but they lack common sense. They might tell you that raising prices increases sales volume, or that rain causes website clicks.
You must review the coefficients (the multipliers assigned to each channel).
Check for these red flags:
Negative Media Impact: Does the model say spending on Facebook Ads decreased* sales? Unless you ran a truly offensive ad, this is a statistical error called multicollinearity.
- Positive Price Elasticity: Does the model say raising prices increased volume? In 99% of businesses, price increases reduce volume. Read more on Price Elasticity of Demand to understand the economic theory behind this.
- Zero Baseline: Does the model claim that without ads, you would sell absolutely nothing? For most established brands, this is false. You have brand equity.
This is where BlueAlpha fundamentally changes the workflow. While other platforms force you to manually hunt for logic errors in endless spreadsheets, BlueAlpha’s automated diagnostics engine flags violations of economic principles instantly. It ensures that the outputs align with economic reality before you ever see them, saving teams 10+ hours per validation cycle and preventing embarrassing presentations to the C-suite.
To get a deeper understanding of how these logic checks fit into the bigger picture, review our marketing ROI analysis guide.
[IMAGE: Infographic showing "The Smell Test" checklist. Items include: Positive Media Coefficients, Negative Price Elasticity, Realistic Baseline, Seasonality Alignment.]
Alt text: Checklist for validating marketing mix model business logic.
!Checklist for validating marketing mix model business logic.*
Once you validate MMM results, you need to interpret them. The most powerful visualization is the Decomposition Chart (often called contribution charts).
Contribution charts break down your total sales into buckets:
- Baseline: Sales you get from brand awareness, distribution, and seasonality (no marketing spend).
- Marketing Contribution: Incremental sales driven by specific channels (TV, Search, Social).
- External Factors: Impact of competitors, economy, or weather.
The Baseline Trap
A common mistake is ignoring the baseline. If you attribute 100% of sales to marketing, your ROI looks amazing, but it's a lie.
This creates a distorted view of marketing ROI. For example, if you sell umbrellas, sales spike when it rains. If you were running Google Ads during the rain, a bad model gives credit to Google. A good model gives credit to the rain.
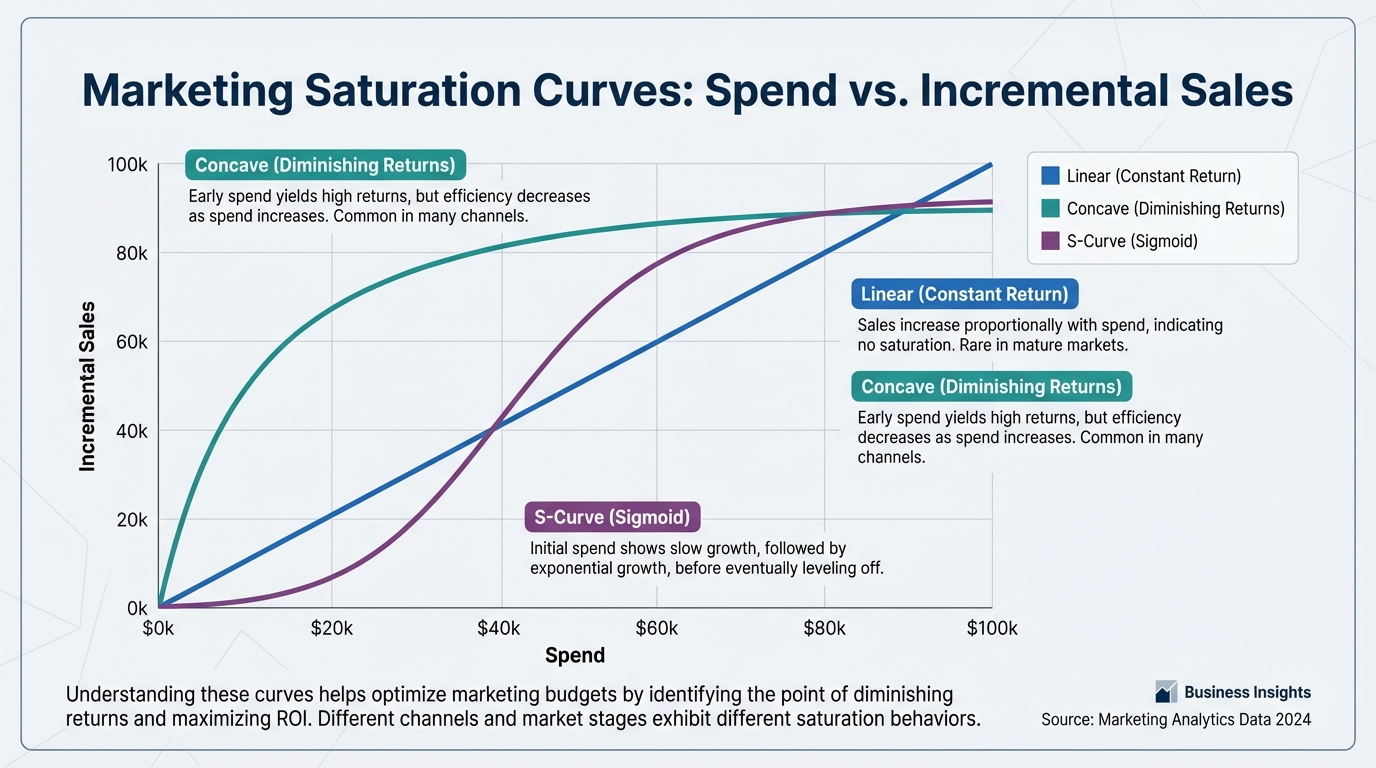
Diminishing Returns and Adstock
Interpretation isn't linear. Spending double the budget rarely yields double the results.
Your model should show Saturation Curves.
- Linear: Every dollar works as hard as the last. (Rare).
- Concave: Efficiency drops as spend rises. (Normal).
- S-Curve: You need a minimum spend to see impact, then it scales, then it flattens.
Furthermore, marketing doesn't happen in a vacuum of time. This is where adstock measurement becomes critical. Adstock measures the "carry-over" effect of advertising. A TV ad you run today might drive sales next week. If your model doesn't account for adstock, it will misattribute sales to the wrong time period, messing up your media budget optimization.
[IMAGE: Chart showing three saturation curves: Linear, Concave, and S-Curve. The X-axis is Spend, Y-axis is Incremental Sales.]
Alt text: Marketing saturation curves showing diminishing returns.
Caption: Understanding where you sit on the saturation curve is key to scaling budget efficiently.
!Marketing saturation curves showing diminishing returns.*
This is the advanced class. If you want to truly trust your model, you don't just watch it; you test it.
MMM is correlational. It looks for patterns. To prove causation, you need experiments.
The Calibration Loop:
- Model Prediction: The MMM says Facebook Ads drive 15% of sales.
- Experiment: You run a Geo-Lift test (turn off Facebook in Ohio for 2 weeks).
- Comparison: Did sales in Ohio drop by the predicted amount?
- Recalibration: Feed that result back into the model to fix the error.
This process is often referred to as "Triangulation." You are using bottoms-up attribution, top-down MMM, and lift studies to find the truth. Leading tech companies like Meta advocate heavily for GeoLift testing to ground your models in reality.
Research from Harvard Business Review suggests that integrating experiments with modeling improves ROI by up to 15-20% compared to using modeling alone.
Modern platforms handle this calibration automatically. When comparing Google Meridian MMM or Meta Robyn, look for how easily they ingest experimental data. Open-source tools often require manual coding for this, whereas solutions like BlueAlpha integrate it natively, making calibration a one-click process rather than a coding project.
Also, consider the statistical concept of Multicollinearity. According to Statistics By Jim, severe multicollinearity can make your coefficients swing wildly, making calibration even more essential to pin down the truth.
Troubleshooting Failed Validations
What happens when your marketing mix modeling results fail the validation tests? Do not panic. It usually points to a specific data issue.
1. High Intercept / High Error
If your model has a massive "unexplained" bar in the contribution charts, you are missing a variable.
- Action: Look for external factors. Did a competitor launch a product? Did you change pricing?
- Resource: Review our which MMM is best comparison to see how different models handle external variables.
2. Volatile Coefficients
If Facebook's impact jumps from 2.0 to 0.5 week over week, your model is unstable. This usually happens when you have "multicollinearity"—two channels moving in lockstep (e.g., you always increase Search spend when you increase TV spend).
- Action: You may need to group these channels together or run a lift test to isolate the signal.
3. Granularity Issues
If you are trying to model B2B data with too much granularity, the model will fail. B2B sales cycles are long and data is sparse.
- Action: Aggregate your data. Instead of modeling "LinkedIn Sponsored InMail," model "Total LinkedIn."
- Resource: Consult the account-based marketing attribution guide for specific B2B modeling tactics.
[IMAGE: Flowchart showing "Troubleshooting MMM". Steps: Check Data -> Check Variables -> Check Granularity -> Run Lift Test.]
Alt text: Flowchart for fixing marketing mix model errors.
Caption: Systematic troubleshooting saves models that initially fail validation.
!Flowchart for fixing marketing mix model errors.*
Even with a validated model, you can misread the map.
1. Confusing Short-term vs. Long-term
MMM is great at long-term trends, but it can be slow. If you launch a campaign today, don't expect the MMM to catch it tomorrow. It needs data density.
For real-time decisions, you might still look at platform metrics, but for budget allocation, trust the MMM. This is a key distinction in the MTA vs MMM comparison.
2. The "Unknown" Bucket
Every model has an intercept or an error term. If your "Unknown" or "Unexplained" contribution is high (over 15-20%), your model is missing a major variable.
Did a competitor lower prices? Did you change your website checkout flow? Did a global pandemic hit? You need to identify these variables. Model decomposition helps isolate these factors, but it requires human intuition to identify what the data is missing.
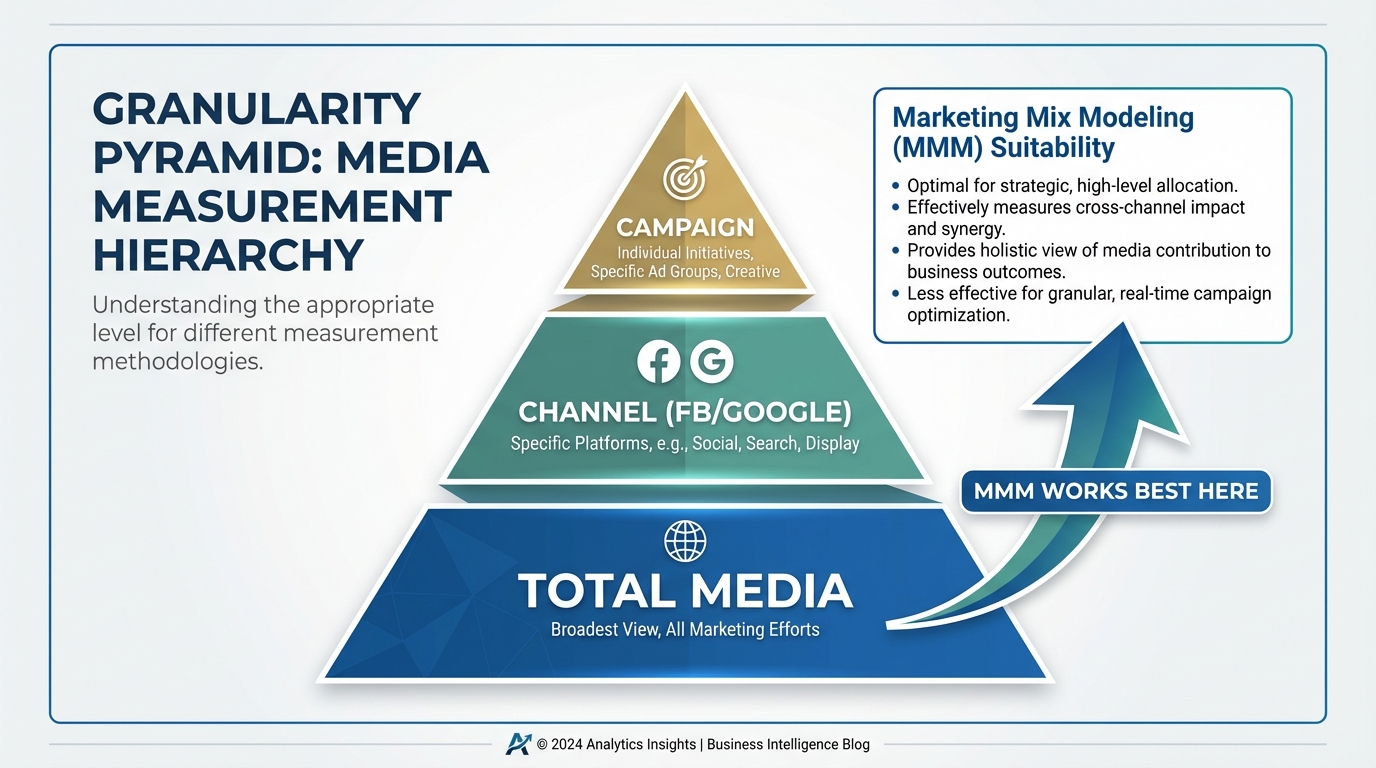
3. Granularity Overload
Don't try to model "Facebook - Retargeting - Blue Creative - Tuesday." MMM works best at the channel or campaign level.
If you try to get too granular, the data becomes too sparse, and the model crashes. For specific channel tactics, rely on platform data, but use MMM to set the overall funnel stage budget allocation.
[IMAGE: Illustration of a "Granularity Pyramid". Base is "Total Media", middle is "Channel (FB/Google)", top is "Campaign". An arrow indicates MMM works best at the Base and Middle.]
Alt text: The hierarchy of marketing measurement granularity.
Caption: MMM excels at strategic allocation, not creative-level testing.
!The hierarchy of marketing measurement granularity.*
Validation is hard work if you are using spreadsheets or raw Python code.
Open-source libraries like Robyn or Meridian are powerful, but the validation burden falls entirely on you. You have to write the code to check the R-squared. You have to build the plots to check the saturation.
Commercial platforms simplify this.
- BlueAlpha: Positioned as the premier choice for automated validation. It runs thousands of iterations and selects the one that passes both statistical tests and business logic constraints. It essentially acts as a guardrail against bad data science, delivering incremental lift insights you can trust immediately.
- Recast: Uses Bayesian methods to handle updates.
- Measured: Heavily focused on incrementality testing.
When evaluating tools, check our Recast vs BlueAlpha comparison or the Measured vs BlueAlpha comparison to see how different methodologies handle validation.
If you are heavily invested in specific channels, like influencer campaigns, ensure your tool can isolate those signals. See our influencer marketing performance measurement guide for specifics on how to model that data.
According to McKinsey, the most successful companies are those that move away from manual data wrangling and adopt automated platforms that allow for continuous validation.
Step-by-Step Validation Checklist
Before you present marketing mix modeling results to your CFO, run this checklist:
- Data Quality: Are there gaps? Is the spend data accurate?
- Fit Metrics: Is MAPE < 10%? Is R² > 0.8?
- Holdout Test: Did the model predict the last 3 months accurately?
- Logic Check: Are price elasticities negative? Are media lifts positive?
- Baseline Check: Is the baseline realistic for your brand maturity?
- Calibration: Have you compared results against a recent lift test?
Conclusion
You cannot manage what you cannot measure. But measuring incorrectly is worse than not measuring at all.
To validate MMM is to protect your budget. It ensures that when you ask for another million dollars for YouTube ads, you are doing it based on causal reality, not a statistical glitch.
Don't settle for a "black box" model. Demand transparency. Check the holdout testing results. Challenge the coefficients.
If you are ready to move beyond spreadsheets and deploy a model that validates itself, explore how to deploy a media mix model effectively. The future of marketing isn't just about big data; it's about accurate data.
Ready to stop guessing? BlueAlpha automates the validation process, running rigorous diagnostics on every model update. See how BlueAlpha ensures 95%+ accuracy automatically.
FAQ
How often should I validate my MMM results?
You should monitor statistical metrics (MAPE/R²) every time the model updates (weekly or monthly). A full holdout test and logic review should happen quarterly or whenever you make major changes to your strategy.
Can I validate MMM with small data sets?
It is difficult. MMM generally requires at least 2 years of historical data to be statistically significant. With less data, the validation metrics (like R-squared) might look good simply because the model is overfitting the small sample size.
What is the difference between R-squared and Adjusted R-squared?
R-squared increases every time you add a variable, even if that variable is useless. Adjusted R-squared penalizes you for adding useless variables. Always prioritize Adjusted R-squared to ensure you aren't just stuffing the model with noise to make it look "accurate."
Why does my MMM contradict my Google Analytics data?
Google Analytics uses Last-Click attribution, which ignores views and upper-funnel impact. MMM measures incremental lift regardless of clicks. They measure different things. If they matched perfectly, one of them would be redundant. Read more on pipeline attribution to understand these differences.
How do I validate Offline channels like TV or OOH?
Since you can't "click" a billboard, MMM is the primary way to measure them. Validate this by running geo-lift tests (turn off OOH in one city, keep it in another) and seeing if the model's coefficients match the lift observed in the test. See our Out of Home advertising tracking guide for details.