Make Decisions Before You Write a Marketing Measurement Plan
Build a marketing measurement plan that maps business decisions to KPIs, attribution, experiments, MMM, owners, and review cadence.

A marketing measurement plan states how marketing data guides business choices. Most teams fail because they collect metrics first and ask questions later. A reliable marketing measurement plan starts with the specific decisions your team must make. It also states how often your team makes these decisions, and what evidence your team needs to act. Only then do you choose your data sources and modeling methods.
This guide gives a practical marketing measurement template. It links business choices to data models so your organization allocates budget with discipline.
Define Decisions
Do not build dashboards before you list your recurring marketing decisions. A decision needs an owner, a fixed schedule, and alternative actions. If an analysis does not change spend or change creative work, remove it from your plan.
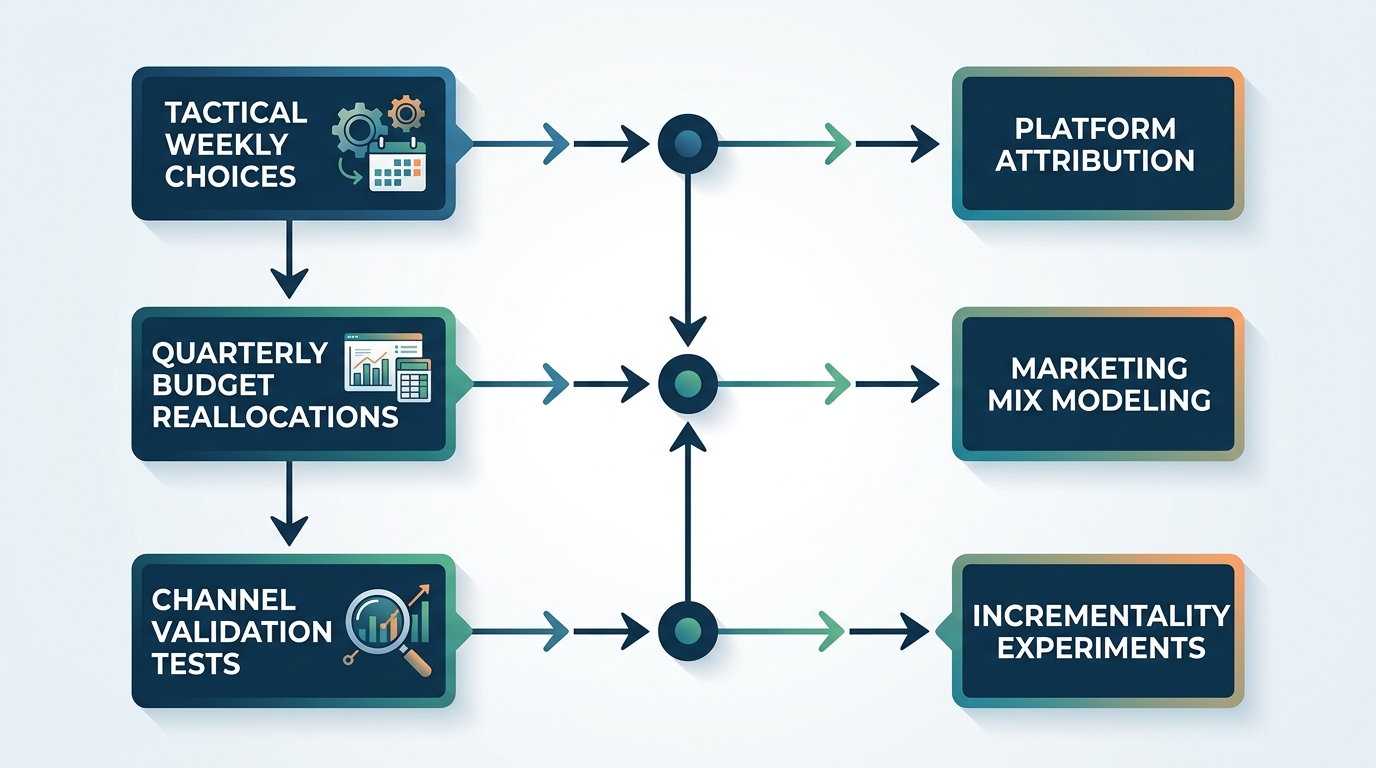
Marketing organizations face three core decisions:
- Tactical optimization: Weekly changes within one channel, such as ad rotation or audience bid adjustments.
- Strategic budget allocation: Quarterly moves of total capital across channels, regions, and business units.
- Program validation: Periodic tests that confirm if a channel drives real sales that would not happen otherwise.
Record the decision owner and the action threshold before you review performance. When your team agrees on decision rules in advance, you prevent arguments when numbers drop. As weareqry.com notes, teams decide faster when they state which tool wins each type of choice before the quarter starts.
| Decision Level | Typical Owner | Action Frequency | Required Action |
|---|---|---|---|
| Tactical | Campaign Manager | Weekly | Shift budget across ad sets or creative variants. |
| Strategic | Chief Marketing Officer / VP | Quarterly | Reallocate budget between offline and digital channels. |
| Validation | Head of Performance Marketing | Bi-annually | Scale, pause, or eliminate an underperforming channel. |
Build the KPI Hierarchy
A key performance indicator (KPI) is a metric your team tracks to judge success. A useful KPI structure prevents information overload. It links small channel metrics directly to top-line business results. Organize your metrics into a strict three-tier hierarchy.
- Business Health KPIs: These metrics show company profit and revenue. Examples include total new-customer revenue, net contribution margin, and blended customer acquisition cost (CAC).
- Diagnostic and Channel KPIs: These metrics track channel efficiency. Examples include cost per acquisition (CPA) by channel and marketing return on investment.
- Operational Metrics: These metrics show tactical health. Examples include click-through rates, impression volume, and conversion rates.
Do not treat operational metrics as proof of strategic success. A high engagement rate means nothing if contribution margin falls. Link operational changes to financial results through a clear measurement plan. Read more about these links in our guide to marketing effectiveness measurement.
Set clear limits for secondary metrics as part of your governance process. For example, if a campaign raises sales volume, you must still check that gross margin stays above your target floor. The guidance published on arcalea.com states that guardrail metrics protect profit while growth teams scale acquisition channels.
Choose Evidence Methods
No single measurement tool answers every business question. A strong measurement plan combines three evidence methods: attribution, marketing mix modeling (MMM), and incrementality testing.
Attribution tracks individual digital user paths. It assigns credit to ad interactions before a sale. Attribution works in near real time. This speed makes it a good fit for optimizations within one channel, such as creative and audience changes. However, attribution shows correlation, not proof of cause. It misses offline activity and struggles with current privacy limits.
Marketing Mix Modeling (MMM) uses combined historical data and statistical regression, a method that finds patterns between factors. It estimates how spend, price, season, and competitor actions affect baseline sales. MMM does not need user tracking or cookies. This method guides large budget decisions across all channels, including television, print, and retail media. When you explain MMM to executives, state that it measures the wider market, not just ad clicks.
Incrementality testing gives proof of cause. It uses controlled experiments, such as geo-lift tests or user holdouts, to show if sales happen because of your ad spend. The research team at thinkwithgoogle.com states that combining statistical modeling with controlled experiments helps analysts check model results against real market lift.
| Measurement Method | Best Decision Use Case | Primary Advantage | Main Limitation |
|---|---|---|---|
| Attribution | Weekly digital ad adjustments | Granular, ad-level speed | Lacks causal proof; biased by tracking limits |
| Marketing Mix Modeling | Quarterly cross-channel allocation | Comprehensive; works without cookies | Needs deep history; slower to detect shifts |
| Incrementality Experiments | Channel validation and model calibration | Measures true causal lift | Requires holdout revenue loss and test runtime |
Organizations gain the most value when they combine these methods into one unified marketing measurement practice. Use incrementality tests to set ground truth. Then use those test results to calibrate your MMM and adjust your digital attribution weights.

Map Data and Owners
Data without a clear owner creates unverified reports. A working marketing measurement plan records every data pipeline, the system of record, and the person who checks data quality.
Set clear data classifications for every metric in your tracking structure. The audit guidance from webase.global states that teams should tag every data feed as verified, directional, or estimated before leaders review it.
Apply these data governance rules:
- Ad Platform Feeds: Track gross spend, impressions, and platform-reported conversions. Owned by channel specialists.
- First-Party Web Analytics: Track site sessions, funnels, and unassisted lead forms. Owned by the web analytics team.
- Business Systems (CRM and ERP): Track billed revenue, canceled orders, and actual margin. This data shows final business truth. Owned by finance and data engineering.
Every KPI needs an owner who checks its accuracy before each report cycle. If your finance ledger shows ten million dollars in revenue, but marketing dashboards claim twelve million dollars, executive teams lose trust. Link your marketing data directly to bank deposits and ledger entries.
Hypothetical Data Quality Matrix:

Metric: Paid Search Ad Spend
System of Record: Platform Billing Invoice
Review Owner: Performance Media Lead
Data Status: Verified (Matches Financial Accounts Payable)

Metric: New Customer Signups
System of Record: Production Database / CRM
Review Owner: Analytics Engineer
Data Status: Verified (Deduplicated on Customer Tax ID)

Metric: Model-Estimated Lift
System of Record: Marketing Mix Model Output
Review Owner: Lead Data Scientist
Data Status: Directional (Calibrated by Q2 Geo-Holdout)
Create a Learning Agenda
A learning agenda turns passive reporting into planned research. It records the key questions your business must test to improve marketing investment over time.
Do not run unplanned tests without a formal process. Plan your research for each half of the business year. The methods shared on eliya.io state that a clear decision rule turns an analysis into a real budget change.
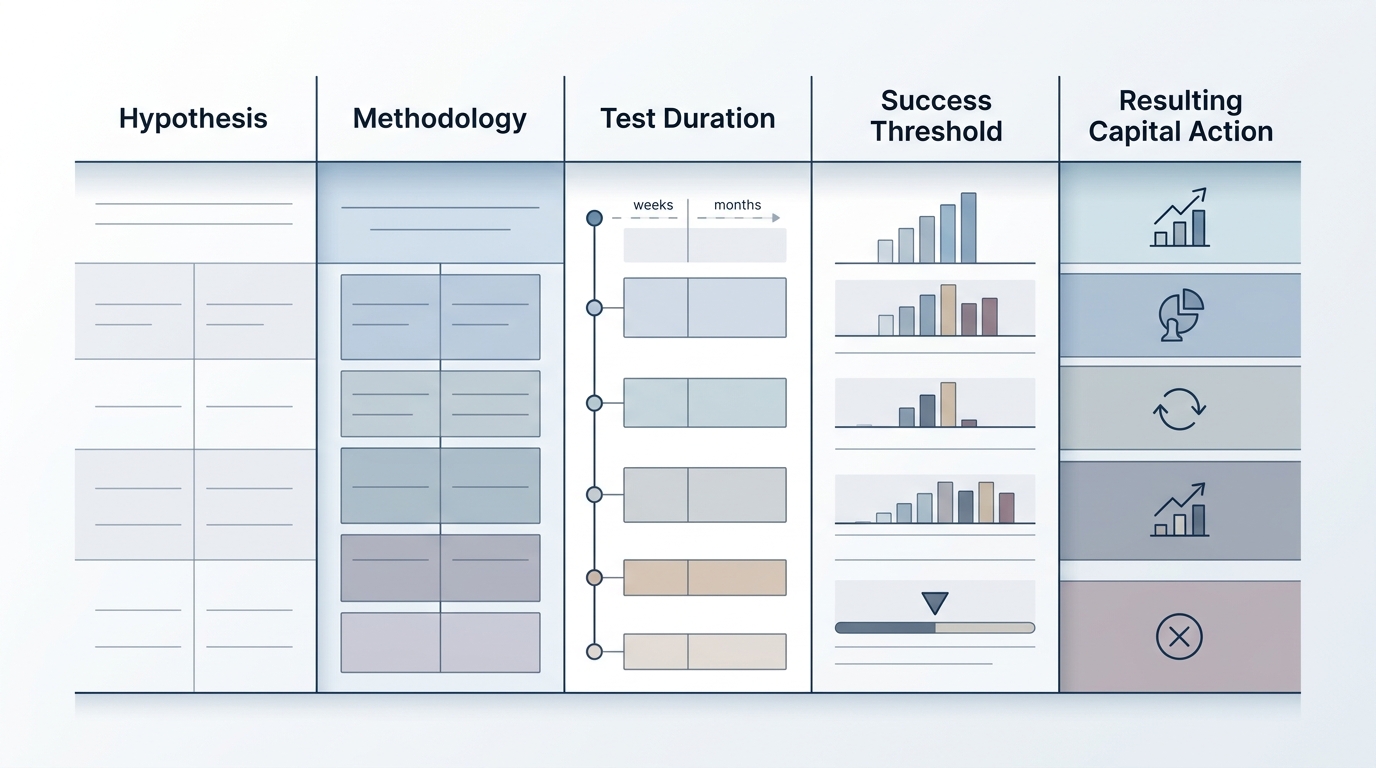
Build every learning agenda item with four required parts:
- Business Hypothesis: State the proposed idea clearly. Example: Paid social retargeting claims credit for customers who would buy through organic search anyway.
- Testing Methodology: Choose the experiment type. Example: A matched-market geo-holdout across ten metropolitan regions for six weeks.
- Success Criteria: State the exact metric threshold. Example: The exposed regions must show a statistically significant ten percent rise in incremental revenue.
- Prescribed Action: State the resulting action. Example: Calculate incremental return on ad spend (iROAS), which is extra revenue per extra dollar spent. If iROAS stays below one dollar, move half of the retargeting budget to prospecting.
Hypothetical Incrementality Calculation:

Incremental Lift = (Sales in Test Markets / Baseline Index) - Sales in Control Markets
Incremental ROAS = Incremental Sales / Test Ad Spend

If iROAS >= 2.50: Increase channel budget by 20%
If iROAS < 1.00: Reduce spend and evaluate audience overlap
Review learning agenda progress each month. Store test results in a central file so staff turnover does not erase what your organization learned.
Governance and Cadence
Governance sets the discipline that keeps your measurement plan working. An unmaintained dashboard stops guiding decisions within weeks. Set a clear review schedule that matches your business cycles. The models from modelreef.io suggest three separate reviews: weekly tactical meetings, monthly manager checks, and quarterly executive reviews.
Run these three recurring reviews:
- Weekly Operator Cadence: Tactical media buyers review ad performance, platform delivery bugs, and conversion tracking health. They make tactical bid and creative changes.
- Monthly Managerial Cadence: Channel leaders review blended customer acquisition cost, organic baseline trends, and progress against the learning agenda. They adjust monthly pacing.
- Quarterly Executive Cadence: The Chief Marketing Officer, VP of Finance, and analytics leads review the marketing mix model results, incrementality test results, and business revenue. They set the macro-budget split for the next quarter.
When data systems show conflicting results, use a set order of priority to settle disputes. Attribution data never overrides an incrementality test on strategic questions. MMM results guide quarterly channel investment, while attribution guides tactical choices within an approved channel budget. Record these rules in your initial plan. When you set the rules early, your meetings focus on decisions, not definitions.
Optimize Your Measurement Strategy
A clear marketing measurement plan helps your team allocate capital with confidence and remove wasted spend. Contact MediaMixModel.com today to book a guided measurement planning session for your organization.
Stay in the loop
Get updates on new posts and resources.