Unified Marketing Measurement: MMM, MTA & Experiments Guide
Stop guessing. Learn how unified marketing measurement combines MMM, MTA, and incrementality testing to give you a single source of truth. Read the guide.
You have too much data and not enough answers.
Your Facebook Ads manager claims 100 conversions. Google Analytics claims 80 of the same ones. Your backend CRM shows 50 actual sales.
Who is lying? Everyone.
The era of relying on a single source of truth—especially pixel-based tracking—is dead. Privacy regulations and browser restrictions killed it. The solution isn't to find a better tracker. It is to change how you measure entirely.
Enter unified marketing measurement.
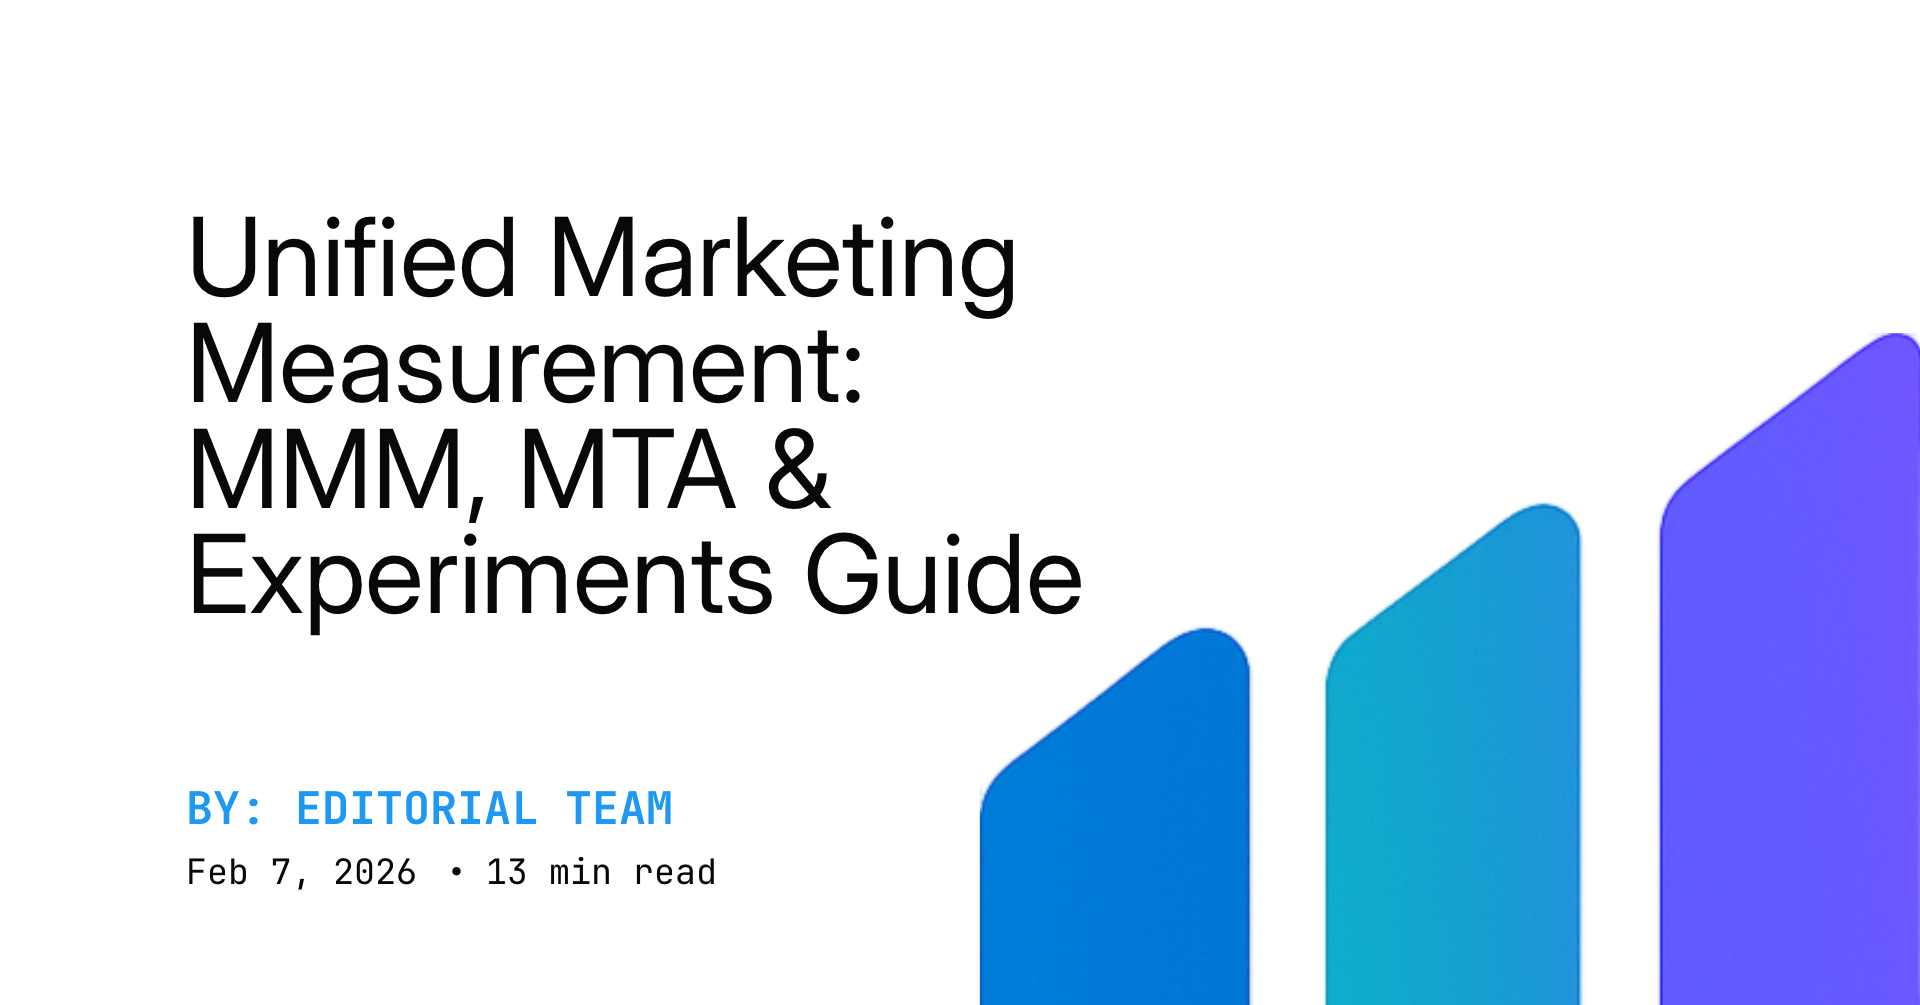
This isn't just a buzzword. It is the mathematical triangulation of three distinct methodologies: Media Mix Modeling (MMM), Multi-Touch Attribution (MTA), and Incrementality Experiments. It represents a shift toward holistic measurement, moving away from siloed channel reporting.
If you are still looking at last-click attribution to make budget decisions, you are burning cash. Here is how to fix your measurement stack and actually understand what drives revenue.
!Venn diagram illustrating unified marketing measurement components.*
The Three Pillars of Truth
Unified marketing measurement works because it acknowledges a simple fact: every model is wrong, but some are useful. By layering three different models, you cover the blind spots of each. This concept is often called marketing triangulation.
You stop looking for one perfect number and start looking for the convergence of evidence.
1. Media Mix Modeling (The Macro View)
MMM is your strategic compass. Often referred to as marketing mix modeling, it looks at aggregate data over time—spend, revenue, seasonality, and economic factors—to determine correlations.
It doesn't care about cookies or user IDs. It respects privacy by default. It tells you that for every $1 you spent on YouTube last quarter, you got $3 back, regardless of what the click data says.
However, traditional MMM is slow. It used to look backward by six months. Modern solutions have changed this, offering near real-time insights. For a deeper dive into the mechanics, check out our media mix model marketing attribution guide.
According to McKinsey, companies that integrate MMM into their strategic planning see a 15-20% improvement in marketing ROI. It provides the top-down view necessary for long-term planning.
2. Multi-Touch Attribution (The Micro View)
MTA is your tactical view. It tracks user paths at the individual level. It is great for understanding the customer journey sequence—did they see an email, then click a search ad, then convert?
But MTA is breaking. iOS updates and cookie deprecation mean MTA creates "holes" in the journey. It overvalues bottom-of-funnel channels (like Retargeting) and undervalues top-of-funnel awareness. The IAB (Interactive Advertising Bureau) has repeatedly warned that the loss of third-party cookies renders legacy attribution modeling obsolete for cross-site tracking.
Despite its flaws, it is still useful for day-to-day optimization within specific platforms. You can understand the differences in granular tracking in our MTA vs MMM marketing attribution comparison.
3. Incrementality Experiments (The Calibration)
This is the scientific method applied to marketing. You turn a channel off (or hold out a control group) and see what happens to total revenue. This is often referred to as incrementality testing.
If you turn off Facebook Ads and sales drop 10%, but Facebook claimed credit for 30% of sales, you know Facebook is over-reporting.
Experiments provide the "ground truth" numbers you use to calibrate your MMM and MTA models. Without conversion lift studies, your models are just guessing.
The Great Debate: MMM vs MTA
For years, marketers fought a war of MMM vs MTA.
The digital natives swore by MTA because it offered immediate, user-level feedback. The traditional brand marketers swore by MMM because it accounted for TV and radio.
Both sides were wrong.
Relying on MTA alone creates a "performance plateau." You optimize for efficiency until you strangle your growth, cutting off the top-of-funnel demand generation that MTA can't measure. Relying on MMM alone creates "speed blindness." You might wait three months to realize a creative concept is failing.
Unified marketing measurement ends the MMM vs MTA debate by using both. You use MMM to set the budget and MTA to optimize the bid.
Why You Need Unified Marketing Measurement Now
Relying on one method leads to disaster.
If you rely only on MTA, you will cut all your brand marketing because it doesn't generate immediate clicks. Your pipeline will dry up in six months. If you rely only on MMM, you might miss granular creative fatigue that is happening right now in your TikTok account.
According to a recent study by Gartner, 60% of CMOs plan to cut marketing analytics teams that rely solely on user-level data by 2027 due to inaccuracy. The shift to unified modeling is not optional; it is a survival mechanism.
Furthermore, privacy legislation like GDPR and CCPA has made user-level tracking a legal liability. A robust unified model reduces this risk by relying less on PII (Personally Identifiable Information).
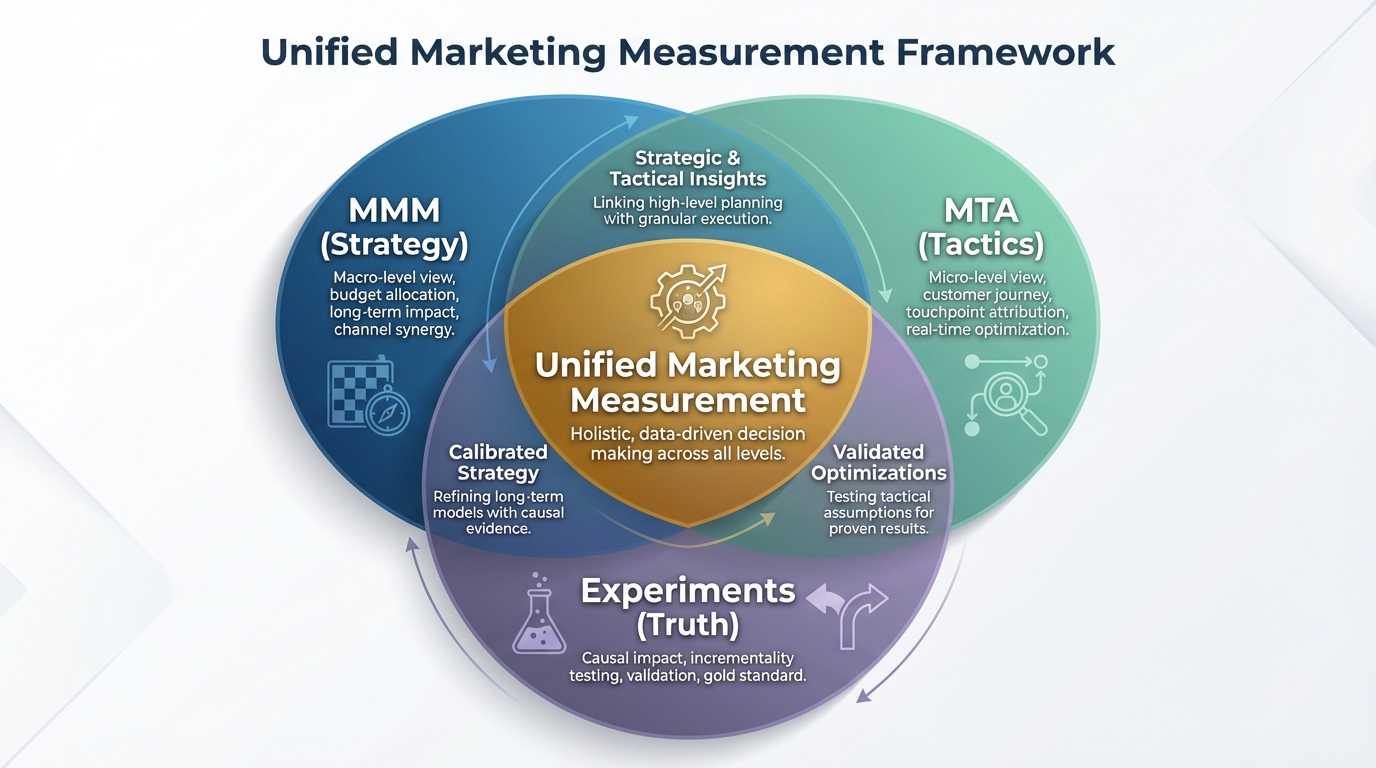
[IMAGE: A flowchart showing data flowing from various sources (Ads, CRM, Organic) into a central 'Unified Model' box, which then outputs 'Budget Allocation' and 'ROI Forecasts'.]
Alt text: Flowchart of data ingestion for unified marketing measurement.
Caption: Data unification is the prerequisite for accurate modeling.
!Flowchart of data ingestion for unified marketing measurement.*
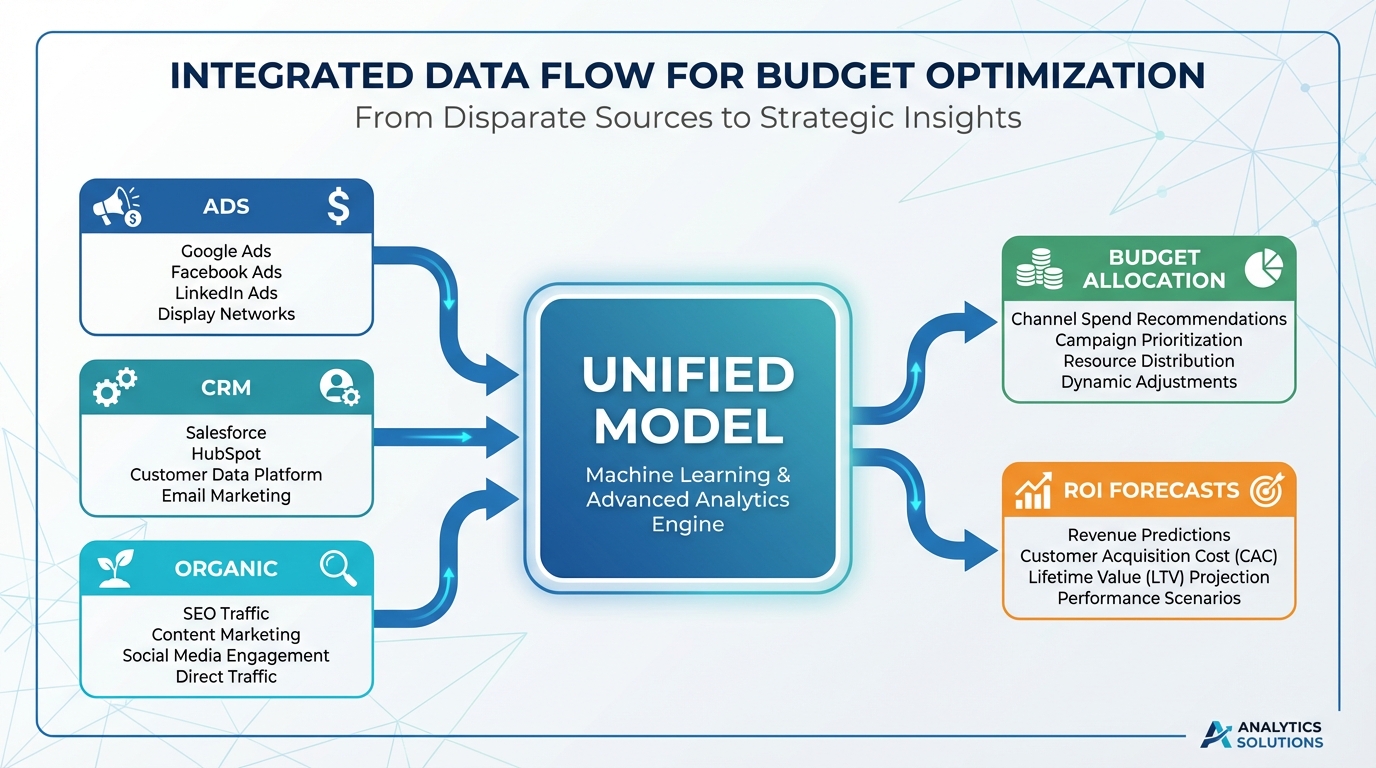
You don't need a team of twenty data scientists to start. You need a process.
[IMAGE: A 3-step horizontal process diagram: 1. MMM Baseline (Foundation), 2. MTA Layering (Detail), 3. Lift Calibration (Validation).]
Alt text: Three steps to building a unified measurement framework.
Caption: Start with the baseline, layer details, then calibrate with truth.
Suggested dimensions: 1200x675px
!Three steps to building a unified measurement framework.*
Run a regression model to establish a baseline. This gives you the "contribution" of each channel. If you are unsure which modeling approach fits your business size, read our media mix modeling comparison.
Step 2: Layer in Attribution Data
Feed your granular attribution data into the system. Use this to inform the "priors" of your MMM.
For example, if your MTA says Paid Search drives 20% of sales, tell your MMM that 20% is a likely starting point, but allow the model to adjust up or down based on the aggregate data.
This is where platforms like BlueAlpha excel, automating the ingestion of disparate data sources that usually trip up manual Excel models. If you are struggling with data connectors, see our Funnel.io vs BlueAlpha comparison guide to understand the difference between simple aggregation and true modeling ingestion.
Step 3: Calibrate with Lift Studies
This is the most critical step. You must validate your model with incrementality testing.
Run a geo-lift test. Shut off YouTube ads in Ohio for two weeks. Keep them running in similar markets. Measure the difference in total sales (not clicked sales).
Use that result to "fix" your MMM. If the model thought YouTube drove $50k, but the experiment showed $30k, you force the model to respect the experimental result. This process is known as marketing calibration.
This transforms your measurement from a guessing game into a calibrated system. For a detailed breakdown of effectiveness metrics, refer to our marketing effectiveness measurement guide.
The Role of AI in Unification
Historically, unifying these models required massive custom SQL projects.
Today, AI handles the heavy lifting. Bayesian inference allows models to update daily as new data comes in. This statistical approach allows the model to learn from new data without discarding historical knowledge, a concept detailed in academic research from institutions like MIT Sloan.
Tools like Google's Meridian are pushing the boundaries of what's possible with open-source code. We have a full breakdown in our Google Meridian MMM guide.
However, open-source requires engineering resources. Platforms like BlueAlpha wrap these advanced statistical techniques in a user-friendly interface, allowing marketers—not just data scientists—to run the models.
If you are technically inclined and want to build this in-house, you might look at Meta's offering. Read our Meta Robyn open-source MMM guide to see if you have the internal bandwidth for it.
Specific Use Cases for UMM
Unified marketing measurement isn't just for e-commerce giants. It applies across the board.
B2B and Account-Based Marketing (ABM)
B2B journeys are long. A CEO sees a LinkedIn ad, a VP reads a blog, and a Manager books a demo. MTA fails here because the converter isn't the person who saw the ad.
UMM looks at account-level engagement and correlates it with pipeline velocity. It connects marketing spend to closed-won revenue, not just leads. This holistic measurement view is essential for justifying high CAC channels.
For B2B specific nuances, read our account-based marketing attribution guide.
You also need to measure the ROI of those specific accounts. It isn't enough to know marketing works; you need to know which accounts it works on. See our ABM ROI measurement guide.
Influencer Marketing
Influencers are notoriously hard to track. Promo codes get leaked or forgotten. Links don't get clicked.
MMM picks up the "halo effect" of influencer drops. You see the spike in direct traffic and branded search that correlates with the influencer's post time. Marketing triangulation helps you assign value to that spike even if the tracking link failed.
If you are struggling to justify spend here, check out our influencer marketing performance measurement guide.
Offline and Out-of-Home (OOH)
You cannot click a billboard. MTA is useless here.
Unified measurement is the only way to measure OOH. You treat the billboard location as a variable in your geo-model. Did sales in that zip code rise relative to the control group?
We cover this extensively in our Out-of-Home advertising tracking guide.
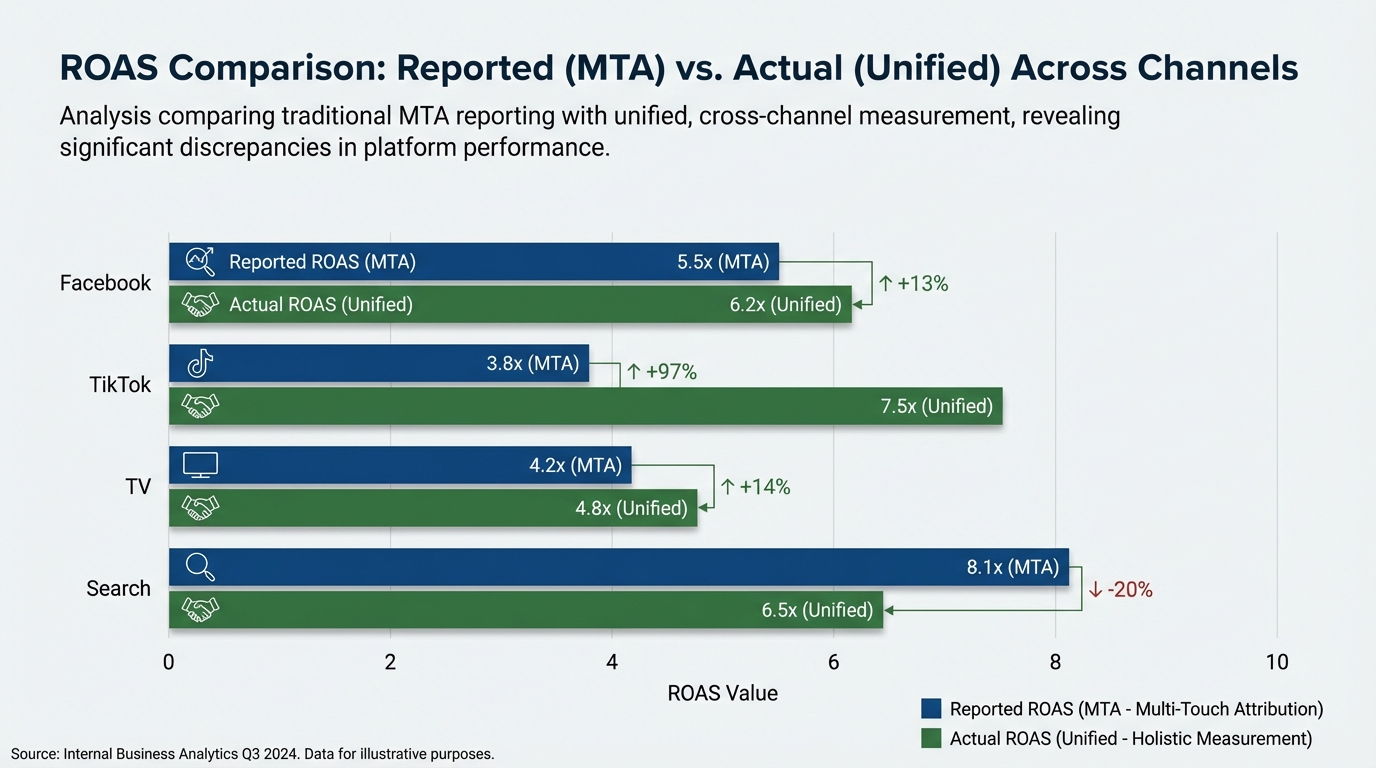
[IMAGE: Bar chart comparing 'Reported ROAS' (MTA) vs 'Actual ROAS' (Unified) for different channels like Facebook, TikTok, and TV. TikTok shows higher Actual ROAS, Search shows lower.]
Alt text: Comparison chart of Reported vs Actual ROAS by channel.
Caption: Unified measurement often reveals that social platforms are undervalued by last-click models.
Suggested dimensions: 1200x675px
!Comparison chart of Reported vs Actual ROAS by channel.*
Your performance team will hate it at first. Why? Because their ROAS numbers might drop. When you remove the double-counting of MTA (where Google and Facebook both claim the same sale), efficiency looks worse on paper. But it is accurate.
The "Black Box" Fear
Executives often distrust what they can't see. An Excel sheet with clicks feels tangible. A Bayesian model feels like magic.
You must explain that the model is transparent. It uses inputs they recognize (spend, revenue) to produce outputs they care about (profit). Transparency is key. If you are evaluating tools, you need to know how they handle data. See how we stack up against others in our Recast vs BlueAlpha comparison.
Data Quality
Garbage in, garbage out. If your historical spend data is messy, your model will fail.
Before you start modeling, audit your data taxonomy. Ensure campaign names are consistent. According to Forrester, poor data quality is the primary reason analytics projects fail.
If you are using tools like Funnel.io to aggregate data, you are halfway there. But aggregation isn't modeling. See the difference in our Funnel.io alternatives marketing data platforms post.
The Pipeline Disconnect
In B2B, a common failure point is the disconnect between marketing leads and sales pipeline. Unified measurement forces you to look at the entire funnel.
If you don't connect your CRM data properly, your model will optimize for leads that don't close. You must track the full journey. Learn more about this in our pipeline attribution article.
Budget Optimization: The End Game
The goal of measurement isn't just to report numbers. It is to allocate capital.
Once you have a unified model, you can run "what-if" scenarios.
- "What happens if I move $50k from Search to TikTok?"
- "What is the diminishing return point of my YouTube spend?"
This allows for predictive budget allocation. You stop reacting to yesterday's ROAS and start investing for next month's profit.
For a tactical approach to moving money around, read our media budget optimization guide.
Furthermore, you need to know where in the funnel to put that money. UMM helps you balance brand vs. performance. See our funnel stage budget allocation guide.
Selecting the Right Platform
The market is flooded with tools claiming to do this.
Some are glorified reporting dashboards. Others are black-box consulting firms that charge six figures and take three months to report back.
You need a platform that:
- Connects to your data automatically.
- Updates models continuously.
- Allows for experimental calibration using incrementality testing.
According to Bain & Company, the companies that succeed in the post-cookie era will be those that own their measurement infrastructure rather than renting it from ad networks.
We have compared the landscape extensively to help you choose.
If you are looking at enterprise solutions, you might consider Measured. See how they compare in our Measured.com vs BlueAlpha comparison.
For those in the Shopify ecosystem, Triple Whale is popular, but often lacks the statistical rigor of true MMM. Read our Triple Whale vs BlueAlpha comparison.
Other contenders like Northbeam rely heavily on pixel tracking, which is fading. See our Northbeam vs BlueAlpha comparison.
There are also newer entrants focusing on AI-specific attribution. If you are exploring those, check our WorkMagic vs BlueAlpha comparison.
Ultimately, you want a partner, not just a vendor. BlueAlpha focuses on transparency and speed, giving you the power of an in-house data science team without the overhead.
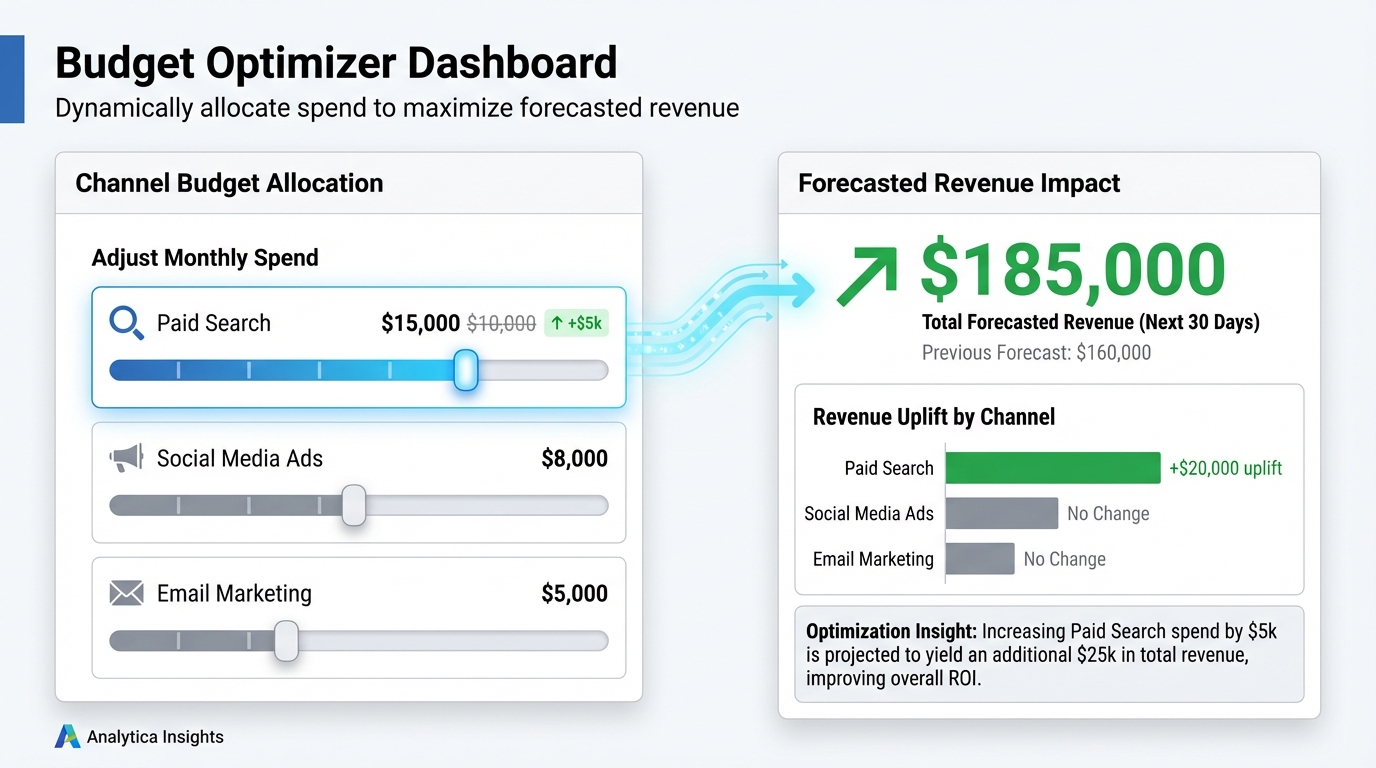
[IMAGE: A dashboard screenshot showing a 'Budget Optimizer' slider interface where increasing spend on one channel automatically adjusts forecasted revenue.]
Alt text: Marketing budget optimization interface.
Caption: Modern tools allow you to simulate budget changes before spending a dime.
Suggested dimensions: 1200x675px
The Future is Hybrid
!Marketing budget optimization interface.*
According to Harvard Business Review, the resurgence of MMM combined with modern computing power is reshaping how the C-suite views marketing investment.
Don't let data silos dictate your strategy. Triangulate your truth.
If you are ready to stop guessing and start measuring, it is time to deploy a model. Read our step-by-step how to deploy media mix model guide to get started today.
FAQ
Q: Can I do Unified Marketing Measurement in Excel?
A: Theoretically, yes. But it is painful. Managing data ingestion from 10+ channels, running regression analysis, and updating it weekly is a full-time job. Dedicated platforms automate the grunt work so you can focus on strategy.
Q: How long does it take to get results?
A: With modern AI-driven tools like BlueAlpha, you can get your first model in a few days once data is connected. Traditional consulting approaches can take 3-6 months.
Q: Do I need to stop using Google Analytics?
A: No. GA4 is still useful for checking website health, landing page performance, and basic trends. Just don't use it to decide your entire media budget.
Q: Is this only for large enterprises?
A: No. If you are spending over $20k/month on ads across 2+ channels, you have enough signal to benefit from MMM and unified measurement.
Q: How does this help with ROI?
A: It eliminates waste. By identifying channels that claim credit but don't drive incremental revenue, you can cut spend without hurting sales. For a deep dive on this, read our marketing ROI analysis guide.
Q: What is the difference between conversion lift studies and MMM?
A: Conversion lift studies (experiments) tell you the causal impact of a specific channel at a specific moment. MMM tells you the correlation of all channels over time. Unified measurement uses the lift study to calibrate the MMM.