Marketing Scenario Planning Requires Hard Choices
Build marketing scenario plans with explicit assumptions, channel constraints, response curves, uncertainty, and decision thresholds.
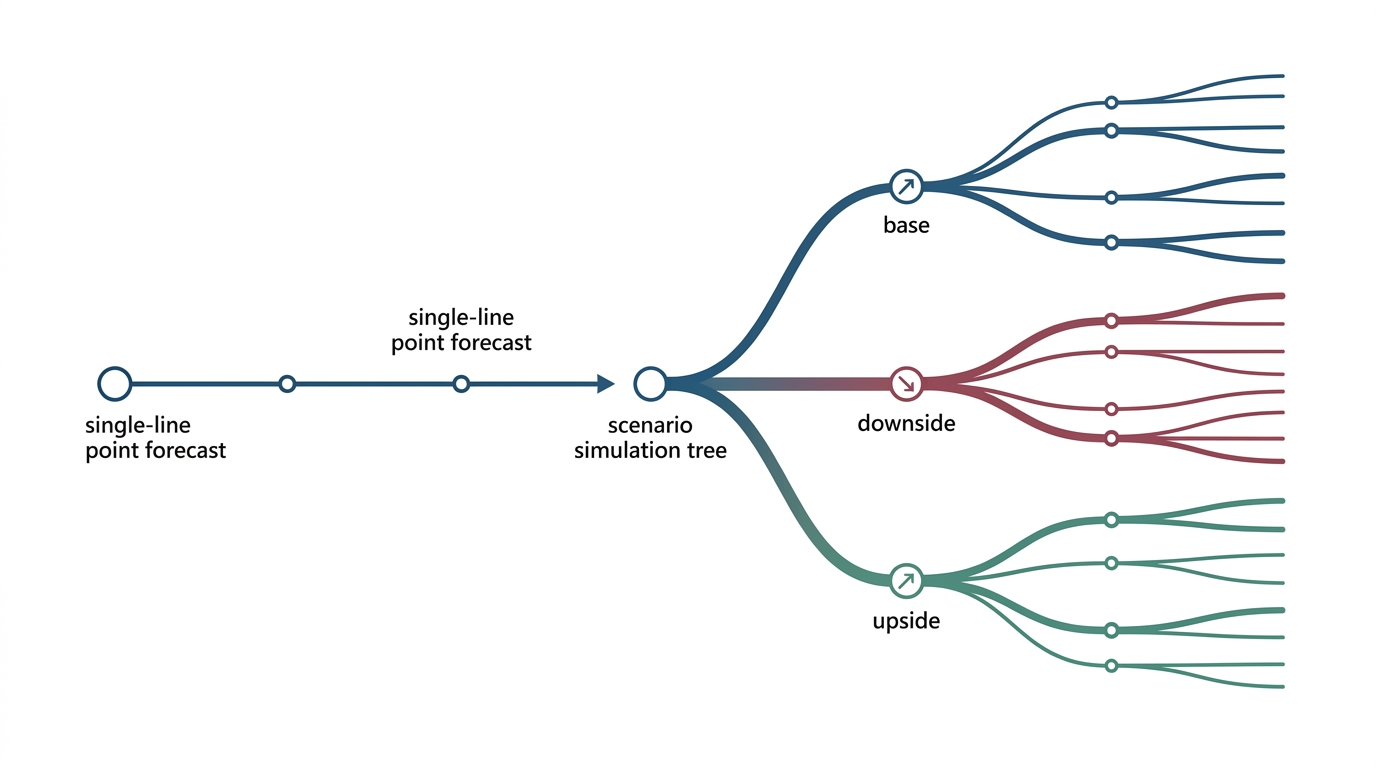
Marketing scenario planning simulates different budget allocations to evaluate risk and financial return before you spend capital. A static forecast estimates sales under one set of conditions. Marketing mix modeling (MMM) measures the statistical link between aggregate media spend and sales revenue. Scenario planning uses MMM response curves to evaluate trade-offs, enforce spend limits, and prepare for market changes.
Marketers must stop presenting a single point estimate to finance teams. You must present options that balance risk, efficiency, and scale.
Scenario Planning vs Forecasting
Many marketing teams confuse forecasting with scenario planning. A marketing forecast estimates sales from planned spending, past trends, seasonality, and macroeconomic factors. ScanmarQED explains that forecasting requires explicit assumptions about external variables like competitor actions, pricing, and distribution. If these external assumptions prove false, the point forecast fails.
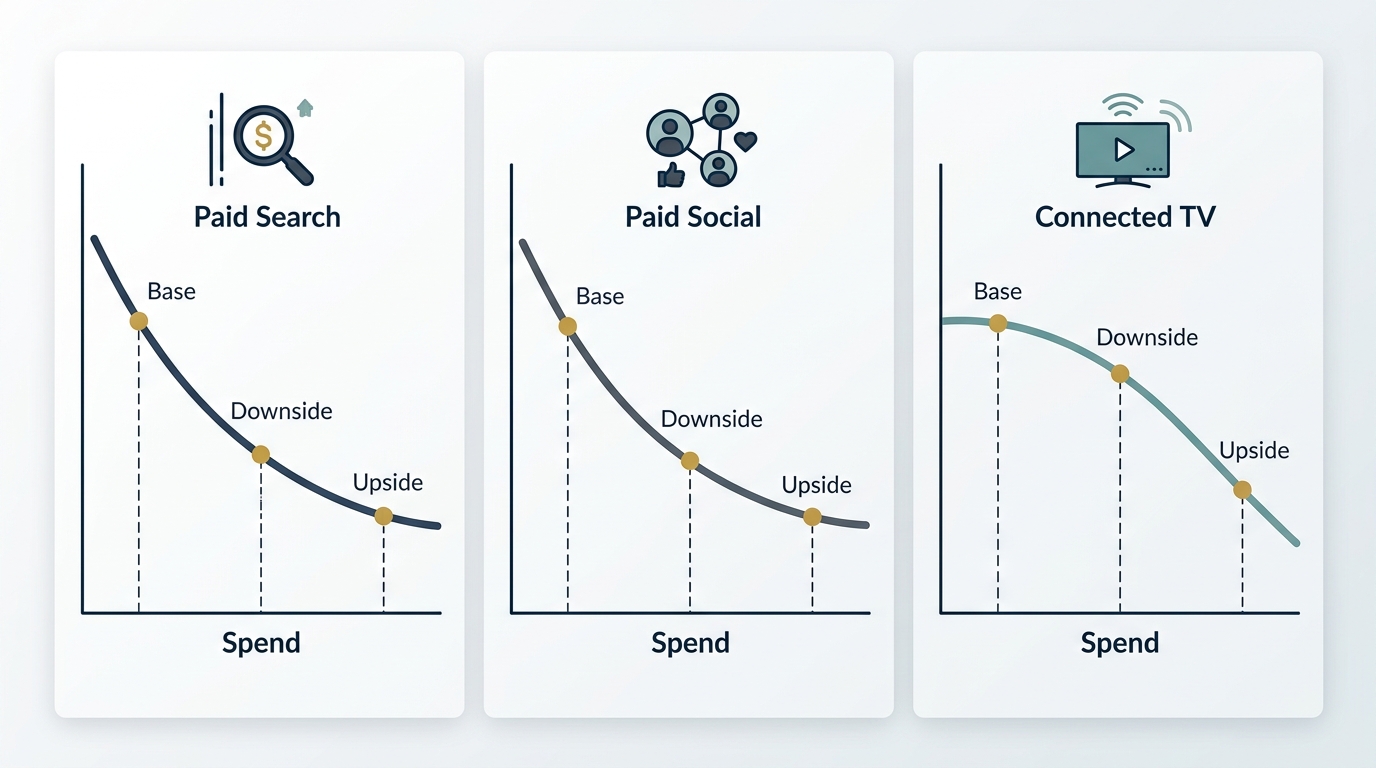
Scenario planning evaluates business outcomes when input variables change. It examines the media mix and asks what-if questions. For example, it tests what happens when you cut paid search spend by 15 percent or increase connected television spend. Instead of providing one passive estimate, scenario planning simulates how response curves behave under different conditions.
These methods depend on your measurement method. Digital attribution tracks user interactions across clicks and browser cookies. However, data privacy rules and offline touchpoints limit digital attribution. Incrementality experiments measure the causal lift of specific campaigns through controlled tests.
Marketing mix modeling calculates the historical link between media spend and business results at an aggregated level. Scenario planning uses these aggregate MMM response curves to calculate the marginal return on ad spend (mROAS). The mROAS shows the gross revenue that the next ad dollar generates. Read our guide on marketing mix modeling forecasting to see how baseline demand separates from media lift.
Define the Decision
Define the business choice before you open an optimization tool. An optimization tool cannot make strategic choices for you. You must select between two primary mathematical formulations: fixed budget optimization and flexible budget optimization.
Fixed Budget Optimization
Fixed budget optimization assumes that leadership sets a hard ceiling on total marketing spend. For example, the finance department authorizes 10,000,000 dollars for the fiscal quarter. The mathematical goal allocates that capital across channels to maximize total revenue or customer acquisitions.
Use fixed budget optimization during periods of strict cash management. The objective function maximizes return:
$$\text{Maximize } \sum_{i=1}^{n} f_i(x_i) \quad \text{subject to} \quad \sum_{i=1}^{n} x_i = B$$
Where:
- $x_i$ is the spend allocated to channel $i$.
- $f_i(x_i)$ is the nonlinear revenue response function for channel $i$.
- $B$ is the total fixed budget.
Flexible Budget Optimization
Flexible budget optimization sets a minimum performance efficiency threshold instead of a spend cap. As documented in Google open-source MMM planning resources, this method lets the model set spend from a target efficiency floor. The floor uses return on investment (ROI) or marginal ROI. Return on investment measures the net profit divided by media cost.
The optimizer funds every channel until the next dollar fails to meet your hurdle rate. This method works well for growing businesses or organizations with open budgets for profitable customer acquisition. For a deeper review of objective functions, examine our media budget optimization guide.
| Planning Dimension | Fixed Budget Optimization | Flexible Budget Optimization |
|---|---|---|
| Primary Input | Total spend envelope ($B$) | Target efficiency threshold (Target ROI / mROAS) |
| Model Output | Optimal channel allocation across $B$ | Total spend recommendation and channel allocation |
| Corporate Context | Fixed capital allocation, recession planning | Growth phases, uncapped profitable demand |
| Primary Risk | Leaving profitable growth uncaptured | Exceeding working capital capacity |
Build Base, Downside, and Upside Cases
Do not present a single plan to leadership. Experienced financial planners build coherent marketing forecast scenarios that reflect different market conditions. Breakthrough3x notes that scenario forecasts should alter material assumptions such as baseline demand, acquisition costs, and capacity, rather than arbitrary percentage targets.
The Base Case
The base case reflects your most realistic view of the next planning cycle. Use historical seasonal demand and current baseline media costs. The base case assumes that macroeconomic conditions remain stable. Channel allocations align with empirical response curves and respect current spend baselines.
The Downside Case
The downside case tests your marketing system against severe market challenges. In this scenario, assume that customer acquisition costs rise or baseline consumer demand falls. Wpromote suggests stress scenarios that factor in cost-per-thousand (CPM) spikes alongside softening industry demand. Cost per thousand measures the advertising cost per one thousand ad impressions.
In a downside case, reduce total spend or reallocate dollars toward channels with high immediate marginal return. Protect high-performing channels that convert active purchase intent. Scale back experimental channels that have flat response curves.
The Upside Case
The upside case models favorable operating conditions. Assume lower advertising unit costs or higher baseline conversion rates from product improvements. The upside scenario shows finance where you can spend marginal capital before you encounter steep diminishing returns.
Hypothetical Scenario Plan
The hypothetical example shows how an enterprise retail brand can structure quarterly marketing budget scenarios:
| Metric | Downside Scenario (Stress) | Base Scenario (Expected) | Upside Scenario (Expansion) |
|---|---|---|---|
| Total Media Spend | $4,000,000 | $5,000,000 | $6,200,000 |
| Paid Search Spend | $1,800,000 | $2,000,000 | $2,300,000 |
| Paid Social Spend | $1,200,000 | $1,600,000 | $2,000,000 |
| Connected TV (CTV) | $600,000 | $900,000 | $1,200,000 |
| Affiliate / Other | $400,000 | $500,000 | $700,000 |
| Projected Revenue | $14,800,000 | $20,000,000 | $23,500,000 |
| Projected Blended ROAS | 3.70x | 4.00x | 3.79x |
| Assumed Conditions | CPMs rise 15%, demand drops 5% | CPMs flat, baseline demand stable | CPMs fall 10%, organic demand rises 5% |
Set Constraints
Unconstrained optimizers generate pure mathematical plans that fail in actual execution. If an algorithm discovers that paid search has high marginal efficiency, it can allocate 90 percent of your budget there.
That recommendation ignores market saturation, channel capacity, and business contracts. As Paramark notes in their media allocation framework, scenario planners must set limits on minimum and maximum channel spend.
You must configure spend constraints before you start simulations:
- Contractual Minimums: Commitments to agencies, upfront television buys, or vendor minimum spend terms. Set lower bounds so the model does not zero out essential channels.
- Channel Saturation Ceilings: Digital channels have finite inventory. Past a specific volume, bid prices escalate rapidly and ad frequency fatigues users. Set an upper bound where marginal returns drop below profitability.
- Operational Bandwidth: Creative production teams cannot rebuild assets overnight. Constrain the rate of spend change to realistic ranges, such as plus or minus 20 percent per quarter.
- Brand vs. Performance Balance: MMM measures direct response quickly. Brand channels take longer to show their full effect through adstock decay. Adstock decay measures how ad memory diminishes over time. Constrain top-of-funnel channels to protect brand equity.
$$\text{Channel Constraint: } L_i \le x_i \le U_i$$
Where $L_i$ represents the minimum spend floor and $U_i$ represents the maximum capacity ceiling for channel $i$.
Quantify Uncertainty
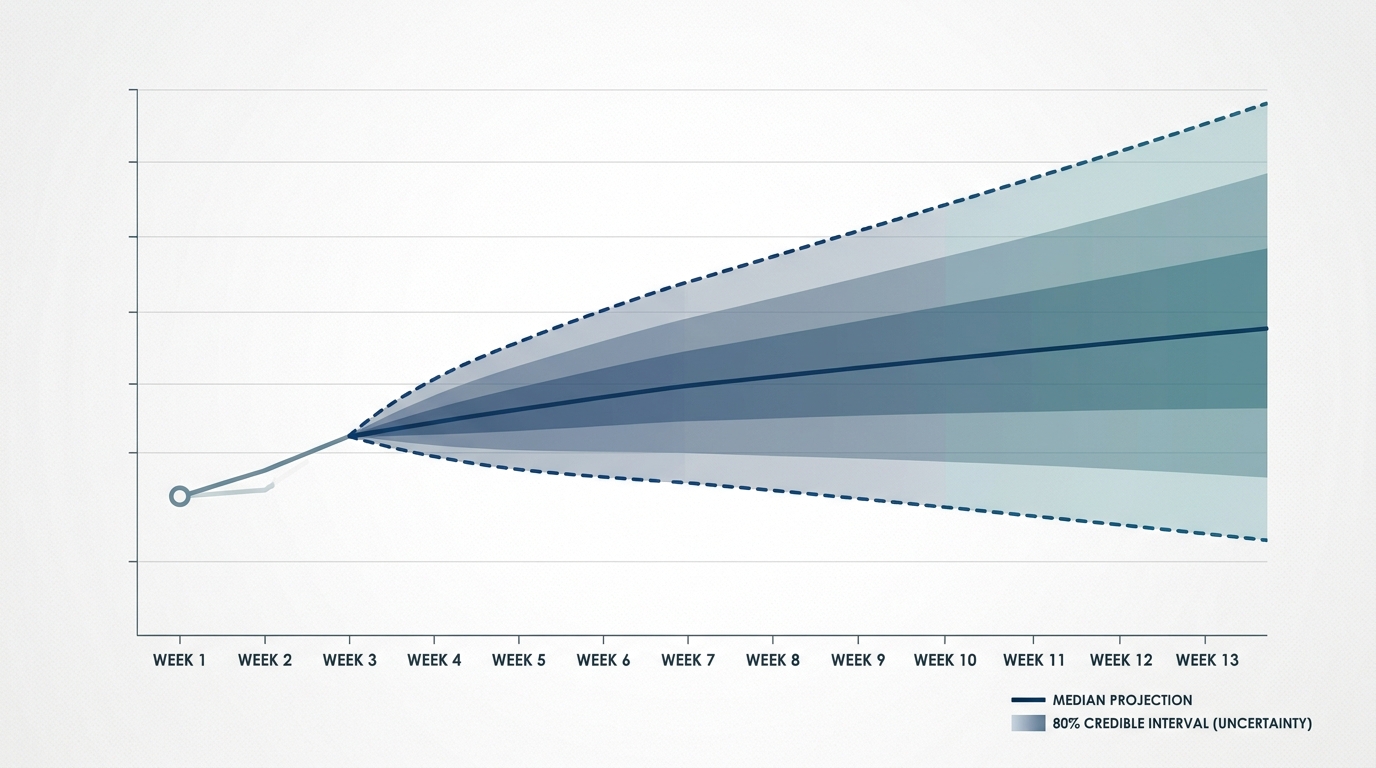
A single revenue prediction creates false confidence. Statistical models produce estimates within probability distributions. When you execute what if analysis marketing, you must quantify and show this uncertainty.
Bayesian marketing mix models generate credible intervals, such as an 80 percent or 95 percent probability range. These intervals reveal the boundary lines of probable outcomes. For instance, project a 5,000,000 dollar spend that yields 20,000,000 dollars in revenue. Your model can show an 80 percent credible interval between 18,200,000 dollars and 21,800,000 dollars.
Uncertainty comes from three main sources:
- Parameter Uncertainty: Imperfect precision in channel elasticity estimates.
- Exogenous Volatility: Changes in macroeconomic health, weather, inflation, or competitor actions.
- Attribution and Measurement Gaps: Differences between experimental incrementality tests and long-term MMM trends.
Show these ranges directly to your stakeholders. When leadership understands the error bounds around an outcome, they can plan financial reserves with greater precision.
Present to Finance
Chief Financial Officers (CFOs) often distrust marketing models. Attribution software vendors make exaggerated claims, and ad platform dashboards count conversions multiple times. Ground your presentation in financial metrics and operational discipline to win budget approval. Our guide on how to explain MMM to executives outlines core communication strategies.
Apply these practical rules when you present marketing budget scenarios:
- Lead with the Decision: Do not start the meeting with statistical theory or adstock curves. Begin with the strategic decision, total investment, and expected returns.
- Present Options, Not Ultimatums: Enter the meeting with your base, downside, and upside cases. A choice between three defined options encourages productive discussions about risk tolerance.
- Show Marginal Returns: Explain why you chose a specific spend level. Show that spending more capital pushes performance past the inflection point into diminishing returns.
- Validate with Incrementality: Confirm your MMM curves with actual test data. Show that empirical proof if an incrementality geo-experiment confirms your model's projected elasticity for television.
- Establish a Tracking Cadence: Commit to a monthly review. Compare actual revenue and media costs to your scenario projections. Explain variances promptly to build trust for future budget cycles.
Marketing scenario planning transforms media planning from an intuitive gamble into a reliable financial discipline. You protect the organization and prove the value of marketing investments when you use realistic constraints and probabilistic outcomes.
Turn measurement into an executive-ready budget plan. Contact our measurement advisory team to audit your marketing mix model and deploy scenario planning for your next fiscal cycle.
Stay in the loop
Get updates on new posts and resources.