A Media Plan Template Must Connect Spend to Goals
Build a media plan covering objectives, audience, channel roles, budget, flighting, reach, frequency, measurement, and optimization rules.
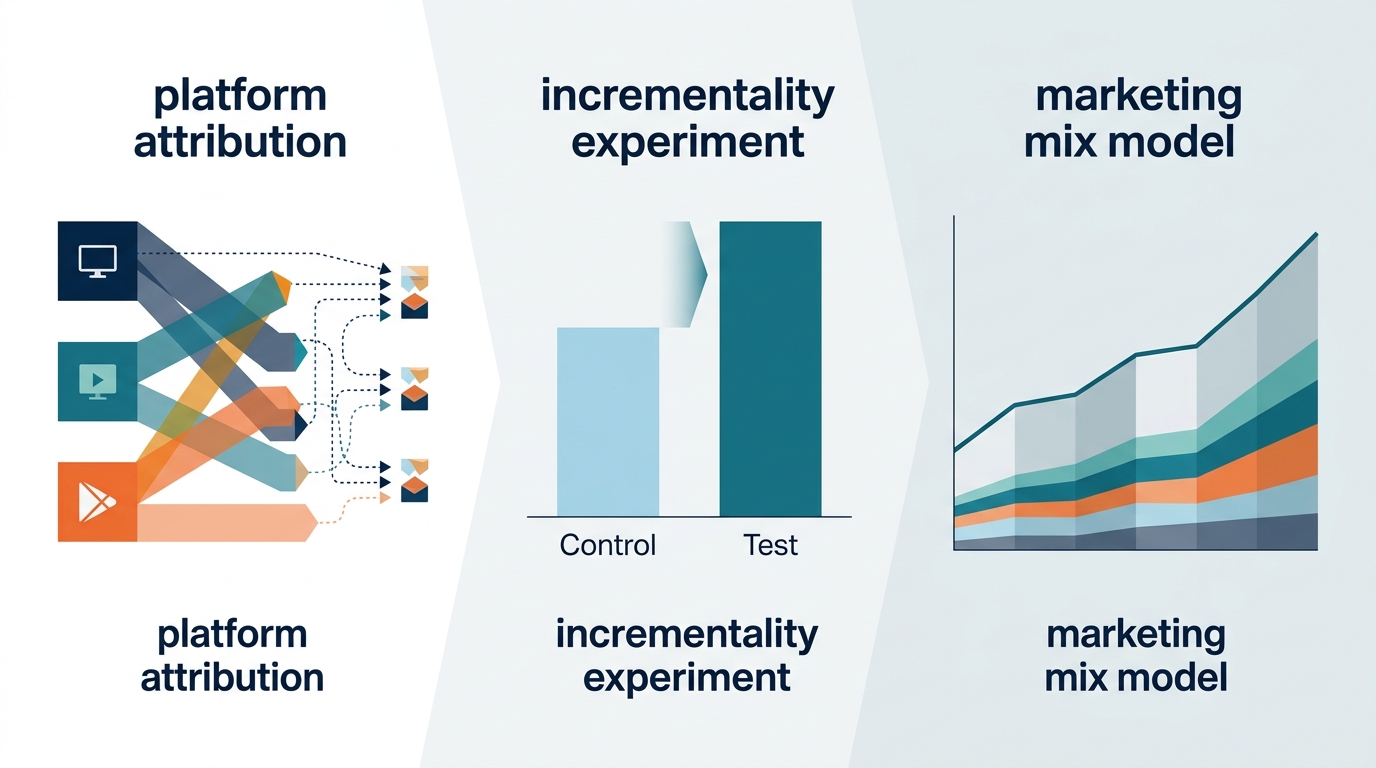
A media plan template must connect every dollar of advertising spend directly to a verifiable business goal. Many marketing teams treat a digital media plan template as an ad inventory list. That mistake hides waste and breaks cross-channel reporting. A rigorous media planning spreadsheet records targeting hypotheses, budget limits, delivery timelines, and performance benchmarks before campaigns launch. It prepares your team to audit channel performance through attribution models, controlled incrementality experiments, and marketing mix modeling (MMM).
Attribution means that you assign credit to ad touchpoints along a consumer path. Incrementality measures the net lift in sales that ad exposure causes compared to a holdout group. Marketing mix modeling uses statistical regression on aggregated data to estimate channel contributions to sales.
Template Overview
A functional paid media plan template organizes media investments into an operational workflow. It aligns the executive forecast with daily buying tactics. Media planners at Tenet emphasize that a plan must make performance logic explicit and testable before ad spend begins. When you enter a row of data, that row must state what you buy, who sees it, when it runs, and what outcome it delivers.
[Campaign Metadata]
Campaign Name: Q4 Growth Engine
Fiscal Period: 2026-Q4
Currency: USD
Total Budget: $300,000
Primary Target: 5,000 New Subscriptions (Max Blended CAC: $60.00)

[Operational Media Grid Structure]
+----+---------+----------+---------------+--------------+------------+-------------+----------+-----------+
| ID | Funnel  | Channel  | Partner/Ad Unit| Flight Start | Flight End | Gross Spend | Est. CPM | Est. Impr |
+----+---------+----------+---------------+--------------+------------+-------------+----------+-----------+
| 01 | Brand   | CTV      | Direct Vendor | 2026-10-01   | 2026-10-31 | $60,000     | $25.00   | 2,400,000 |
| 02 | Retarget| Paid Soc | Meta IG Story | 2026-10-01   | 2026-12-31 | $90,000     | $12.00   | 7,500,000 |
| 03 | Direct  | Search   | Google NonBrnd| 2026-10-01   | 2026-12-31 | $150,000    | $35.00   | 4,285,714 |
+----+---------+----------+---------------+--------------+------------+-------------+----------+-----------+
A complete media planning spreadsheet contains four operational layers:
- Header Metadata: You record the fiscal period, campaign name, overall budget, currency, and strategic business owner.
- Channel Plan Grid: You list the line items for media delivery. Each row captures the channel, platform, ad unit, flight dates, gross spend, expected unit costs, and delivery volumes.
- Pacing and Flighting Calendar: You distribute monthly or weekly spend across the financial quarter to control cash burn.
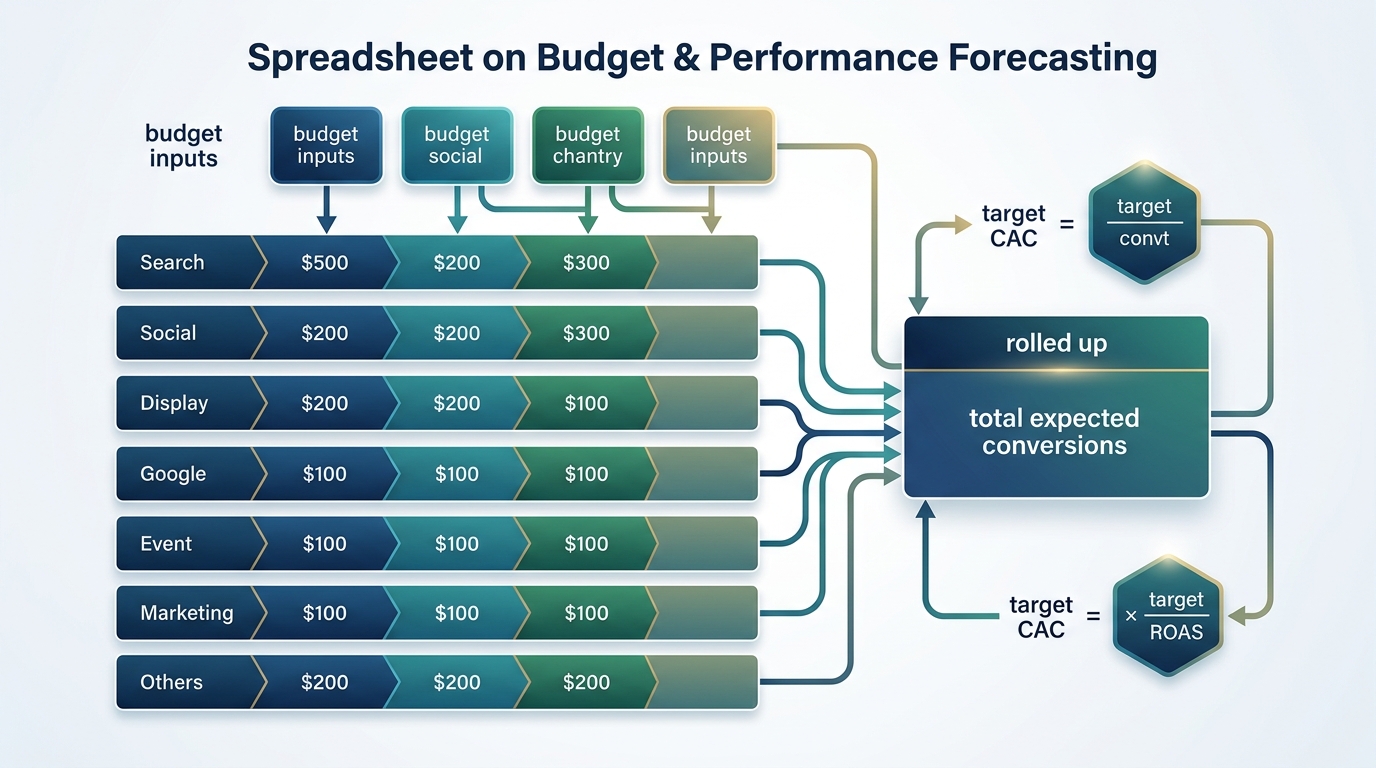
- Summary Reconciliation: You calculate overall reach, expected conversions, and blended efficiency metrics.
Financial reconciliation is a core element of this workflow. As shown in the planning guides at Soku, your spreadsheet must reconcile line-item allocations against total available cash and calculate blended unit economics. For example, calculate your blended customer acquisition cost (CAC) by dividing total spend by total conversions across all channels. Do not average the individual channel cost-per-acquisition (CPA) figures. Averaging separate ratios produces mathematical errors that misrepresent real returns.
Objectives and Audience
Every channel plan must start with an explicit business objective. Do not set vanity engagement targets like clicks or video views as your primary goal. Instead, link each campaign flight to commercial metrics. These metrics include gross margin, qualified pipeline leads, or new customer acquisitions.
Map your target audience segments directly inside the planning document. Media buyers select audience segments in platform ad managers by using strict plan criteria. The template from PostSyncer places audience descriptions, platforms, and primary KPIs side by side. This layout keeps tactics aligned with business outcomes.
| Segment Name | Funnel Stage | Qualifying Traits | Platform Match Method | Primary KPI |
|---|---|---|---|---|
| In-Market Enterprise Buyers | Mid Funnel | IT Directors, companies > 250 employees | First-party list match and LinkedIn B2B graph | Qualified pipeline leads |
| High-Intent Consumers | Lower Funnel | Active category keyword search | Google Search exact match keywords | Cost per conversion |
| Category Prospects | Upper Funnel | Adults 25-54 interested in financial tools | Contextual YouTube and CTV placements | Completed video views and brand lift |
Link audience tiers to clear measurement gates. When planning audience experiments, align your assumptions with our marketing effectiveness measurement guide. This ensures you define attribution boundaries before spending capital.
Channel Roles
A disciplined channel plan identifies why each platform receives budget. Never add a media channel simply because ad inventory is available. Channels perform different roles within an economic portfolio:
- Demand Generation: Upper-funnel video, digital audio, and programmatic display reach net-new consumers. They introduce your brand and generate future market interest.
- Demand Capture: Paid search, affiliate links, and branded retargeting collect existing commercial intent. They capture users who already search for solutions.
- Conversion Validation: Paid social testimonials and targeted direct mail provide social proof. They encourage undecided prospects to complete transactions.
Ad buyers must recognize that ad platforms introduce measurement bias. Platforms claim credit for user interactions whenever their pixels record an impression or click. When you compare channels, understand the difference between platform attribution, incrementality testing, and marketing mix modeling (MMM).
Platform attribution relies on native tracking tags. Google Analytics 4, Meta Ads Manager, and Amazon Ads report conversions through their own click and impression windows. Planning guides at Modern Marketing Institute show that native dashboards systematically overstate their contributions. Each network takes full credit for shared conversions.
Incrementality testing uses randomized control trials to confirm genuine lift. You split audiences into exposed and holdout groups. By measuring the difference in purchasing actions between the groups, you isolate true incremental revenue.
Marketing mix modeling uses aggregated historical spend and revenue data. MMM uses statistical regressions to estimate channel performance. It does not track individual users with cookies or device identifiers. It quantifies how seasonal shifts, baseline volume, and marketing channels drive sales. For a structured financial breakdown of these allocations, use our marketing budget allocation template.
Budget and Flighting
Your media budget worksheet must track both total commitment and the timing of financial outlays. Media planners use three flighting patterns:
- Continuous Flighting: You spend budget at a flat rate across the entire campaign window. This pattern works well for evergreen search demand and stable purchase cycles.
- Flighted (Burst) Flighting: You spend media budget in concentrated intervals, followed by periods of zero ad spend. Planners use this tactic for product launches and seasonal holidays.
- Pulsed Flighting: You maintain a continuous, low spend baseline and add heavy spend bursts during peak buying windows.
The media planning guide from Adcurrent notes that flighting schedules govern how teams resolve seasonal demand and retail calendars. Planners build a media budget worksheet with dedicated columns for weekly flight pacing:
$$\text{Weekly Channel Budget} = \frac{\text{Total Channel Flight Budget}}{\text{Flight Duration in Weeks}} \times \text{Pacing Weight}$$
Use this mathematical model to control flight pacing. Apply pacing weights to alter spend during peak conversion weeks.
| Channel / Tactic | Total Budget | Oct W1-W2 | Oct W3-W4 | Nov W1-W2 | Nov W3-W4 (Peak) | Dec W1-W2 | Dec W3-W4 |
|---|---|---|---|---|---|---|---|
| Programmatic CTV | $60,000 | $15,000 | $15,000 | $10,000 | $10,000 | $5,000 | $5,000 |
| Paid Social (Meta) | $90,000 | $10,000 | $15,000 | $20,000 | $25,000 | $15,000 | $5,000 |
| Non-Brand Search | $150,000 | $20,000 | $20,000 | $25,000 | $40,000 | $30,000 | $15,000 |
| Total Spend Pacing | $300,000 | $45,000 | $50,000 | $55,000 | $75,000 | $50,000 | $25,000 |
This weekly pacing view prevents cash shortfalls before key sales cycles. It forces teams to match ad spend to inventory capacity and business milestones.
Creative and Frequency
Ad fatigue harms campaign returns when platforms show ads to the same users too often. A digital media plan template must define creative assets and specify reach and frequency targets for each channel.
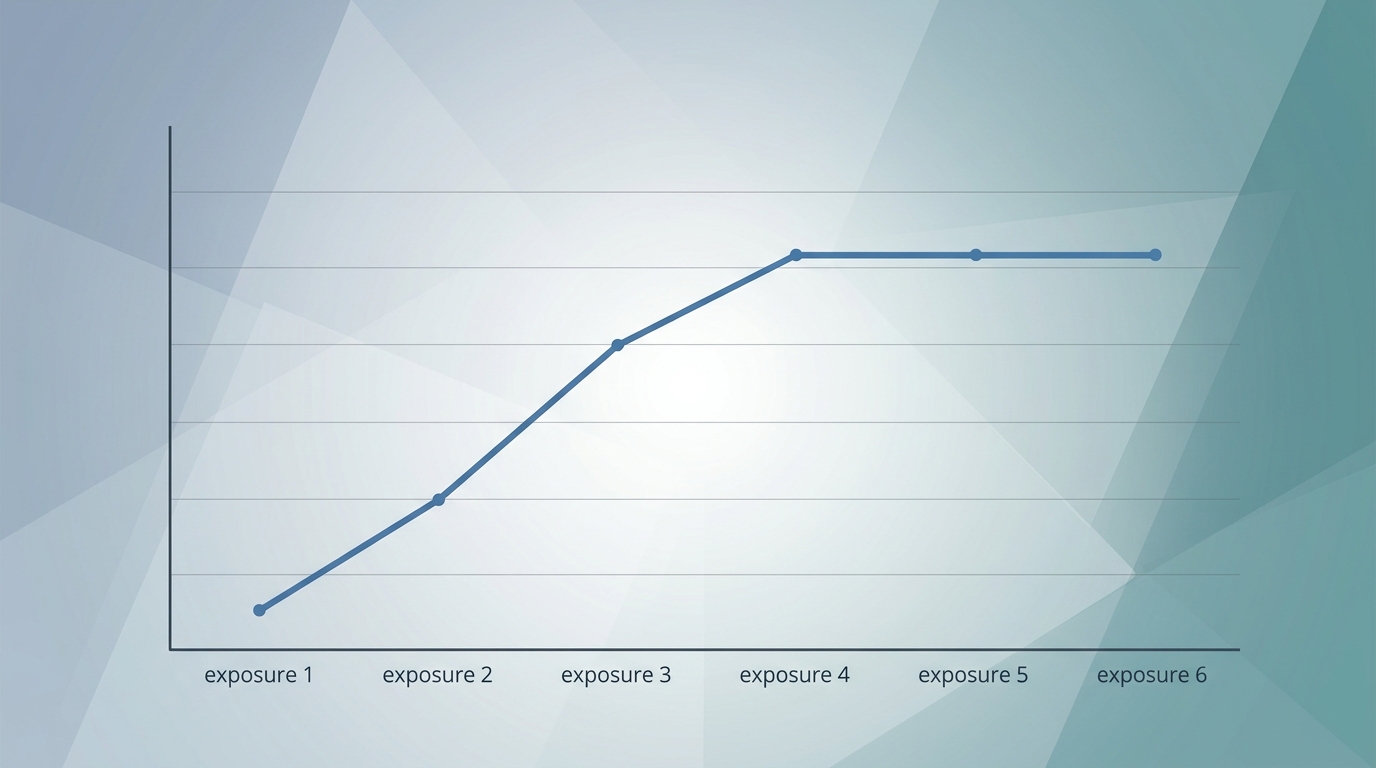
When you balance reach and frequency, apply the law of diminishing returns. Media research from the Advertising Research Foundation demonstrates that consumer response increases with initial ad exposures, but marginal returns decline as frequency climbs higher. Marginal return means the additional output that you gain from one extra unit of advertising spend. High repetition without fresh creative assets causes banner blindness and increases cost per acquisition.
Target Frequency = Total Planned Channel Impressions / Net Reach Target
Use this formula to calculate planned average frequency. Set channel frequency caps in your template to protect audience experience:
- Awareness Video: Cap exposure at two to three impressions per household per week.
- Social Feed Ads: Cap exposure at three to four impressions per user per week across rotating assets.
- Direct Retargeting: Cap exposure at five impressions per user per week, and apply a fourteen-day burn pixel to suppress past purchasers.
Organize your creative requirements directly inside your campaign flighting template:
| Channel | Format Specification | Asset Theme | Weekly Frequency Cap | Refresh Trigger |
|---|---|---|---|---|
| CTV | 30s Video (1080p, 16:9) | Brand Story & Mission | 2 per household | 4 weeks |
| YouTube Ads | 15s Non-Skippable Video | Customer Testimonial | 3 per unique user | 3 weeks |
| Instagram Reels | 9:16 Vertical Video | Problem / Solution Hook | 4 per unique account | CTR drop > 25% |
| Google Display | Responsive Display Ads | Promotion / Offer Push | 3 per unique user | Conversion decay |
Define your creative refresh triggers before launch. If your click-through rate drops by 25 percent over seven days, deploy replacement assets. Recording these rules directly in the plan prevents ad performance decay mid-campaign.
Measurement and Optimization
A media plan template is only as good as the measurement methodology that audits it. When setting budgets across digital channels, review our guide to paid media budget allocation to balance short-term direct conversions against long-term baseline growth.
In your media planning spreadsheet, split performance metrics into primary decision metrics and diagnostic metrics. The media framework by Adcharta states that teams must define measurement rules, reporting cadences, and budget triggers before launch. Never change your primary success metric while a campaign is live.
Return on ad spend (ROAS) means the revenue earned for each dollar of ad spend. Marginal return on ad spend (mROAS) measures the extra revenue generated by the next incremental dollar spent.
- Primary Decision Metrics: You use these values to change budget allocations across channels. Primary metrics include Incremental Cost Per Acquisition (iCPA), Marginal Return on Ad Spend (mROAS), and Total Customer Acquisition Cost (CAC).
- Diagnostic Metrics: You use these values to troubleshoot campaign issues within a single channel. Diagnostic metrics include Click-Through Rate (CTR), Cost Per Mille (CPM), Conversion Rate (CVR), and Impression Share.
Use platform numbers only for relative decisions inside a single channel, such as choosing the winning ad creative or selecting a winning audience ad set. Never use platform-reported numbers to make absolute decisions about overall budget distribution across different ad networks.
Platforms claim shared credit for transactions, so adding up platform-reported conversions overstates total sales. For macro allocation decisions, rely on econometric modeling and holdout tests.
Record optimization rules in your spreadsheet so buying teams can respond to early signals:
[Operational Optimization Triggers]
1. IF Channel iCPA > Target CAC by 20% for 14 days,
   THEN reduce channel spend by 15% and reallocate to top-performing channel.

2. IF Search Impression Share (Budget Lost) > 30% AND Target ROAS met,
   THEN increase daily search budget by 10%.

3. IF Frequency > 5.0 AND CTR drops by 20% over 7 days,
   THEN rotate in secondary creative assets.
Build a Unified Measurement Framework
A media plan template is not a passive tracking document. It is a live operating plan that links financial risk to performance goals. When your template includes audience targets, clear channel roles, disciplined flighting, and strict measurement rules, it protects your business from ad budget waste. It forces your team to define success before spending money in platform dashboards.
We can help your team connect your media plan template to a resilient measurement framework. MediaMixModel.com pairs marketing mix modeling with incrementality tests to show the real economic lift of your advertising channels. Contact us to audit your media planning models and optimize your marketing budget.
Stay in the loop
Get updates on new posts and resources.