Incrementality Testing Platforms Do Not Run the Same Tests
Compare incrementality testing platforms for geo experiments, holdouts, conversion lift, calibration, and ongoing marketing measurement.

Platform shortlist
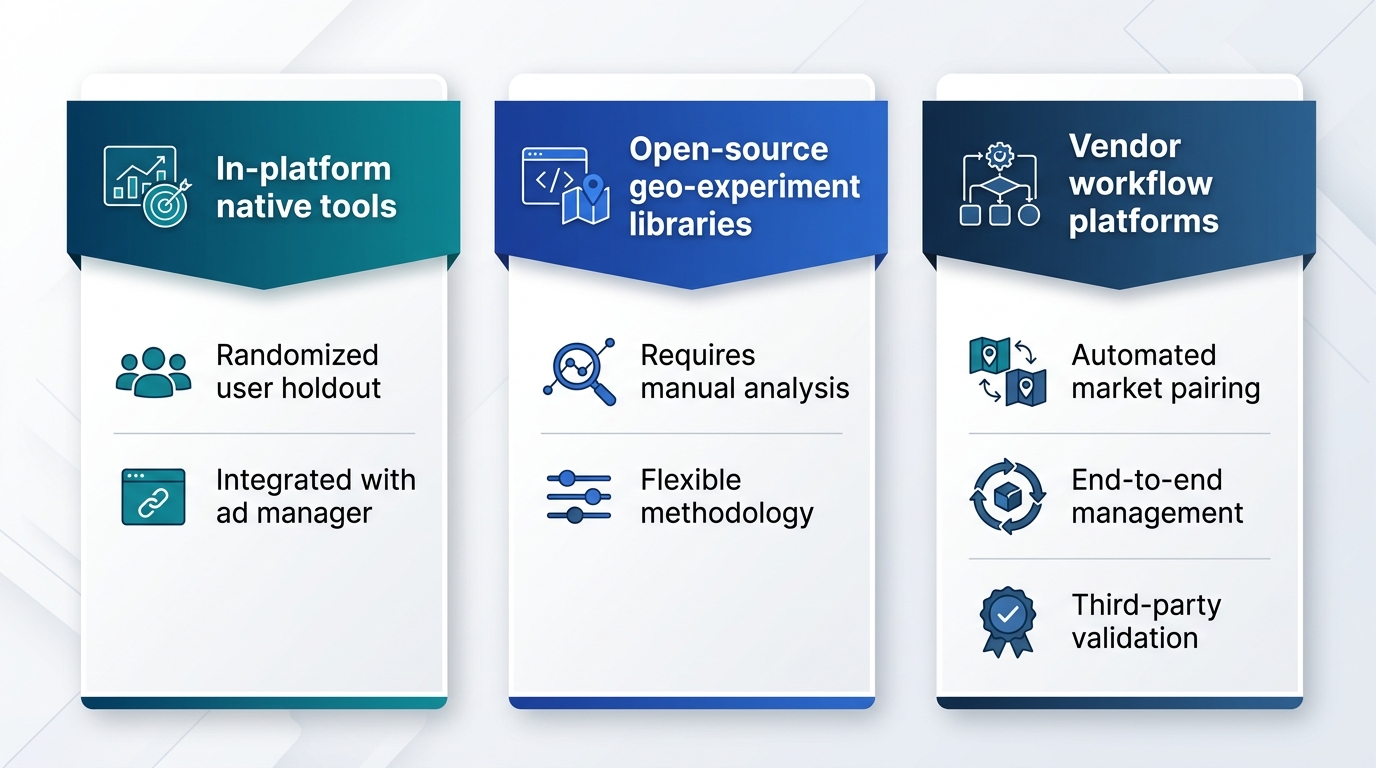
Vendors in this category fall into three groups. Each group generates the causal comparison in a different way.
In-platform, native tools. Meta Conversion Lift and Google Ads geo experiments run inside the ad platform. Ads Manager includes Meta Conversion Lift as a built-in feature. It withholds ads from a randomly selected holdout group. Setup takes less than an hour. These tools measure one channel at a time and depend on the platform's own method for user or geo assignment.
Open-source geo-experiment libraries. Meta released GeoLift as an open-source tool in 2022 and still maintains it. Google publishes CausalImpact, a Bayesian structural time series library. A Bayesian structural time series model is a statistical method that predicts what would have happened without a change, using patterns from past data. This library is the academic foundation most vendors build on.
Google also publishes an open R package for its own geo experiment method. This package implements geo-based regression and time-based regression, two statistical techniques for comparing test and control markets. These libraries require someone to run the analysis. They are not ready-to-use software.
Vendor platforms that wrap geo testing in a workflow. Several commercial platforms automate market pairing, spend changes, and reporting on top of geo or synthetic-control methods. One such platform defines incrementality as the gap between what happened and what would have happened without the spend. It isolates this causal lift by running controlled geo experiments and reports results as ranges, not single lift numbers.
Other vendors, including Recast, Prescient AI, Measured, and Sellforte, pair geo testing with a modeling layer. Treat calibration and integration claims from any vendor as items to verify directly with that vendor, not as proven facts. For a broader review of methods and terms, see our incrementality testing guide.
Types of lift tests
Lift tests differ by what they randomize and at what level they randomize it.
- Geo holdout tests. This test is the most common starting point. You split your markets into matched pairs, that is, comparable cities or regions with similar baseline revenue and seasonal patterns. You then pause the channel in one half for two to four weeks. The revenue gap between the treated markets and the control markets, adjusted against the pre-test baseline, gives you the incremental lift.
- Ghost bids (platform-native conversion lift). This method is the cleanest option when the platform supports it. The auction engine records every impression it would have won but withholds the ad from a random share of users. A Conversion Lift test is a randomized experiment. It measures the incremental impact of ads by comparing outcomes between a test group that can see ads and a control group that cannot.
- Synthetic control methods. This method builds an artificial comparison unit that closely matches the test unit. It uses data from before the test to find a combination of untreated markets that best represents the treated market. This combination becomes the synthetic control for measuring campaign effectiveness.
- Bayesian structural time series. This method uses a Bayesian time-series model to predict what would have happened without the campaign. It works well when you have strong prior knowledge of the market. It also works well when the main outcome metric is not available and the model must use a proxy metric instead.
Each method answers the same question: did a channel cause an incremental outcome? Each method makes different assumptions and reacts differently to noise.
A recent benchmark study gives a useful warning here. No tool reaches the target 95 percent statistical confidence level while still reliably detecting real incremental effects. Causal Impact detects most real lifts but produces a false signal from noise nearly a third of the time. GeoLift keeps false positives near the target rate but misses most real effects. This means the choice of test design involves a trade-off between false positives and missed effects, not a search for one correct tool.
Evaluation criteria
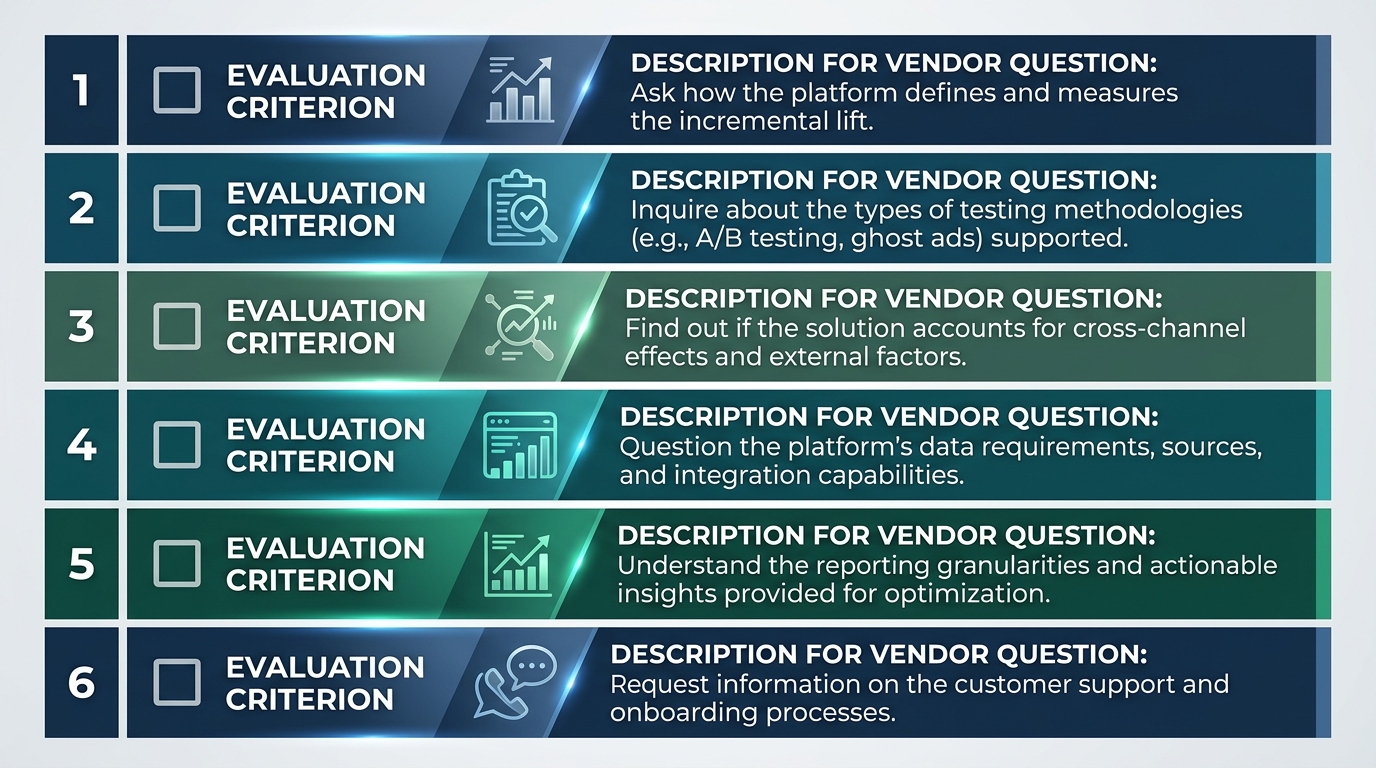
Judge a platform on how well it fits your operations, not on accuracy claims you cannot verify. Use these criteria.
- Test design support. Does the platform support the design that fits your channel: geo holdout, ghost bid, or synthetic control?
- Minimum scale requirements. Native platform tests need enough volume to detect an effect. You generally need about 5,000 conversions in the test group for a reliable result. This fits always-on campaigns at full budget, not a small test group.
- Test duration. Typical test windows run four to eight weeks, depending on scale and variance in the data.
- Cross-channel scope. A single-platform test measures only that platform. A native Meta test measures Meta's incrementality alone. It does not show how Meta interacts with Google or with organic traffic.
- Analysis transparency. Can you see the matched-market logic, the confidence interval, and the model assumptions? Or does the platform show only a final lift number?
- Path to calibration. Does the platform have a documented method to feed test results into a broader model? Can you verify that method independently?
Tool comparison
The table below compares test design and operational fit. It does not rank tools by accuracy, because public documentation cannot support that kind of claim.
| Platform type | Test design | Channel scope | Typical minimum scale | Analysis effort |
|---|---|---|---|---|
| Meta Conversion Lift | Randomized user holdout, in-platform | Single platform (Meta) | Platform-set minimums; scale to reach detectable effect | Low, built into Ads Manager |
| Google geo experiments / GeoX | Geo-based regression or time-based regression | Google Ads, YouTube, Display | Google specifies a practical minimum scale of approximately $50,000 a month on the tested channel | Moderate, uses Google tooling |
| Meta GeoLift (open source) | Synthetic control geo experiment | Any channel with geo-level spend data | Depends on donor market pool size | High, requires an analyst to run the R package |
| Google CausalImpact (open source) | Bayesian structural time series | Any channel with a time series KPI | Depends on length of pre-period data | High, requires an analyst to run the library |
| Vendor geo-testing platforms | Matched-market geo holdout, often with model calibration | Multi-channel, cross-platform | Varies by vendor; verify directly | Low to moderate, workflow automated |
For a direct comparison of incrementality against other measurement methods, see MMM vs. MTA vs. incrementality.
Data and sample requirements
Every lift test design has a floor below which results become unreliable.
Geo holdout tests need enough markets to form matched pairs. They also need enough baseline history to detect a change against normal variance. Open-source project documentation and platform guidance for conversion lift recommend a minimum detectable effect of 5 to 10 percent. They also recommend a test window of 4 to 8 weeks.
Native conversion lift tests need enough volume in the test group. As noted above, about 5,000 conversions in the test group is a practical floor for a Meta-style test. Below that volume, the confidence interval around the lift estimate becomes too wide to act on.
Worked example (hypothetical). Suppose a brand spends $60,000 a month on a channel across 20 comparable markets. A geo holdout test could hold out 6 of those markets for 6 weeks. Suppose the treatment markets show 8 percent higher revenue than the synthetic control built from the holdout markets. If that gap exceeds the normal pre-test baseline noise, the team has evidence of positive incremental lift. This example uses hypothetical numbers only, not a real client result.
Synthetic control and Bayesian methods need a longer history of data before the test starts, to build a credible counterfactual. A simple matched-pair design needs a shorter history than this.
How incrementality fits with MMM
Incrementality testing, attribution, and marketing mix modeling (MMM) answer different questions with different evidence.
- Attribution assigns credit to touchpoints based on the paths users took before converting. It shows what a user saw before converting. It does not show what caused the conversion.
- Incrementality testing uses a randomized or matched control group to measure what a channel actually caused. MMM observes correlations in statistical data, while incrementality testing runs a controlled experiment.
- MMM uses statistical modeling on aggregate time-series data across all channels. It estimates each channel's contribution and marginal return, the extra outcome you get from one more unit of spend on that channel.
These methods work best together. Most standalone tools run one test and return one lift number. A stronger workflow feeds each causal result back into an MMM as a calibration signal.
This step tightens the model's response curves and sharpens its saturation parameters, the points where added spend stops producing added return. A single geo lift test cannot cover every channel or budget scenario. MMM alone cannot prove causation the way a randomized holdout test can. Read more about how geo experiments and MMM calibration work together in our guide to geo experiments and MMM.
Conclusion
Incrementality testing platforms are not interchangeable. They differ in what they randomize, how much scale they need, and how far their scope reaches across channels. The right choice depends on your channel mix and your budget. It also depends on whether you need a single-channel result or a cross-channel calibration signal for a larger model.
If you want help designing a measurement stack that combines lift tests with MMM, our team can help. We can review your channel mix, spend levels, and reporting goals. We can then recommend a workable test design.

Sources
- The Holdout Test: Measuring True Ad Incrementality · Jordan Glickman
- What is incrementality testing? A 2026 guide for DTC operators | Eightx
- GitHub - google/GeoexperimentsResearch: An open-source implementation of the geo experiment analysis methodology developed at Google. Disclaimer: This is not an official Google product. · GitHub
- Incrementality Testing & GEO Experimentation Platform | LiftLab
- Incrementality Testing: Geo Holdouts & Lift Studies Guide
- Incrementality Testing for Meta Ads: Holdout Groups Guide - Blip
- GeoLift Methodology | GeoLift
- Comparison to other Methodologies | GeoLift
- Open-Source Geo-Experiment Tools — A Head-to-Head Simulation Study | Recast
- Meta Ads Incrementality Testing: How to Know If Facebook and Instagram Actually Drive Sales | Skale Strategy
- 10 Best Incrementality Testing Tools (2026) — SegmentStream
Stay in the loop
Get updates on new posts and resources.