Incrementality Testing Guide: Stop Guessing, Start Measuring
Stop wasting budget on ads that don't drive revenue. This incrementality testing guide shows you how to measure true lift and validate your marketing ROI.

Your ad platform is lying to you.
It’s not malicious. It’s structural. Facebook, Google, and TikTok all claim credit for conversions that might have happened anyway. They report on correlation, but your CFO cares about causation.
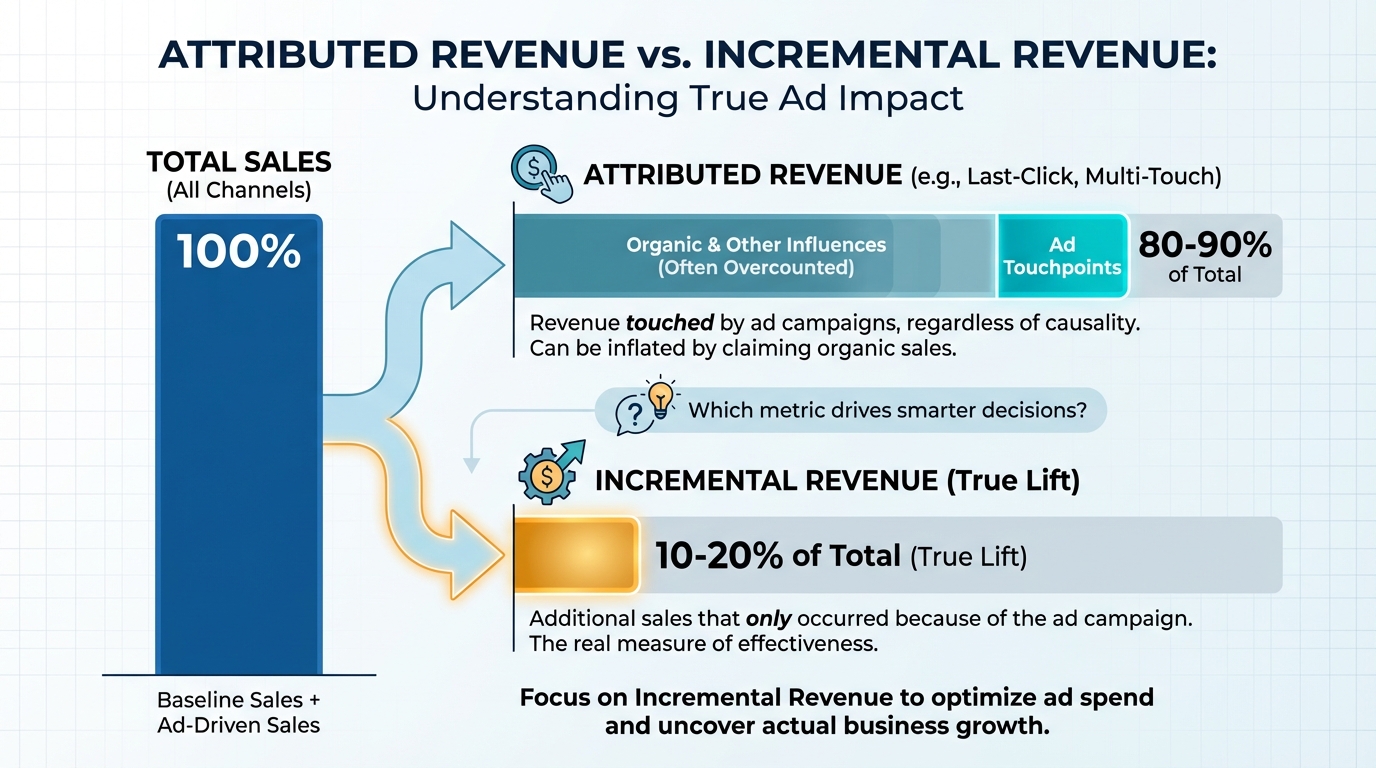
You spend $10,000. The platform reports $50,000 in revenue. A 5x ROAS looks great on a slide deck. But if you had turned those ads off, would you have lost $50,000? Or would you have still made $40,000 from organic search, email, and brand equity?
If you don’t know the answer, you are burning cash.
This incrementality testing guide cuts through the noise. We aren't talking about "multi-touch attribution" or "algorithmic fractional credit." We are talking about the scientific method applied to media spend. This is how you determine exactly which dollars generate new revenue and which ones are just riding the wave.
What Is Incrementality Testing?
Incrementality testing is an experiment designed to measure the true causal impact of a marketing activity. It answers a simple but brutal question: If we didn't run this ad, would this user have converted anyway?
Most marketing reporting relies on attribution. Attribution assigns credit. Incrementality measures lift.
Here is the difference:
- Attribution: "This user clicked a Facebook ad and then bought shoes. Facebook gets credit."
- Incrementality: "We showed ads to Group A but not Group B. Group A bought 10% more shoes. The ads caused a 10% lift."
If you rely solely on platform data, you inevitably over-invest in retargeting. Retargeting captures demand that already exists. Incrementality testing helps you shift budget toward channels that create demand.
To understand how this fits into the broader picture of efficiency, read our marketing effectiveness measurement guide.
Why Attribution Models Fail
Multi-touch attribution (MTA) promised a single source of truth. It failed.
Privacy regulations and technical changes shattered the tracking pixel. You cannot track a user across devices and browsers with 100% accuracy anymore. Apple's updates effectively blinded pixel-based tracking for a massive segment of mobile users. You can read the specifics of these privacy changes in Apple’s App Tracking Transparency documentation.
Even if tracking were perfect, attribution models suffer from selection bias. Algorithms target users most likely to convert. When those users convert, the algorithm takes credit. It’s a self-fulfilling prophecy.
Furthermore, regulations like the General Data Protection Regulation (GDPR) in Europe have made persistent user-level tracking legally risky and technically difficult.
This is why modern measurement stacks have moved away from MTA and toward a "Triangulation" approach:
- Media Mix Modeling (MMM): Top-down strategic view.
- Incrementality Testing: Ground-truth validation.
- Attribution: Day-to-day tactical optimization.
If you are still debating the merits of different attribution models, check out our MTA vs MMM comparison.
Types of Incrementality Tests
Not all tests work for all channels. You need to match the methodology to the medium.
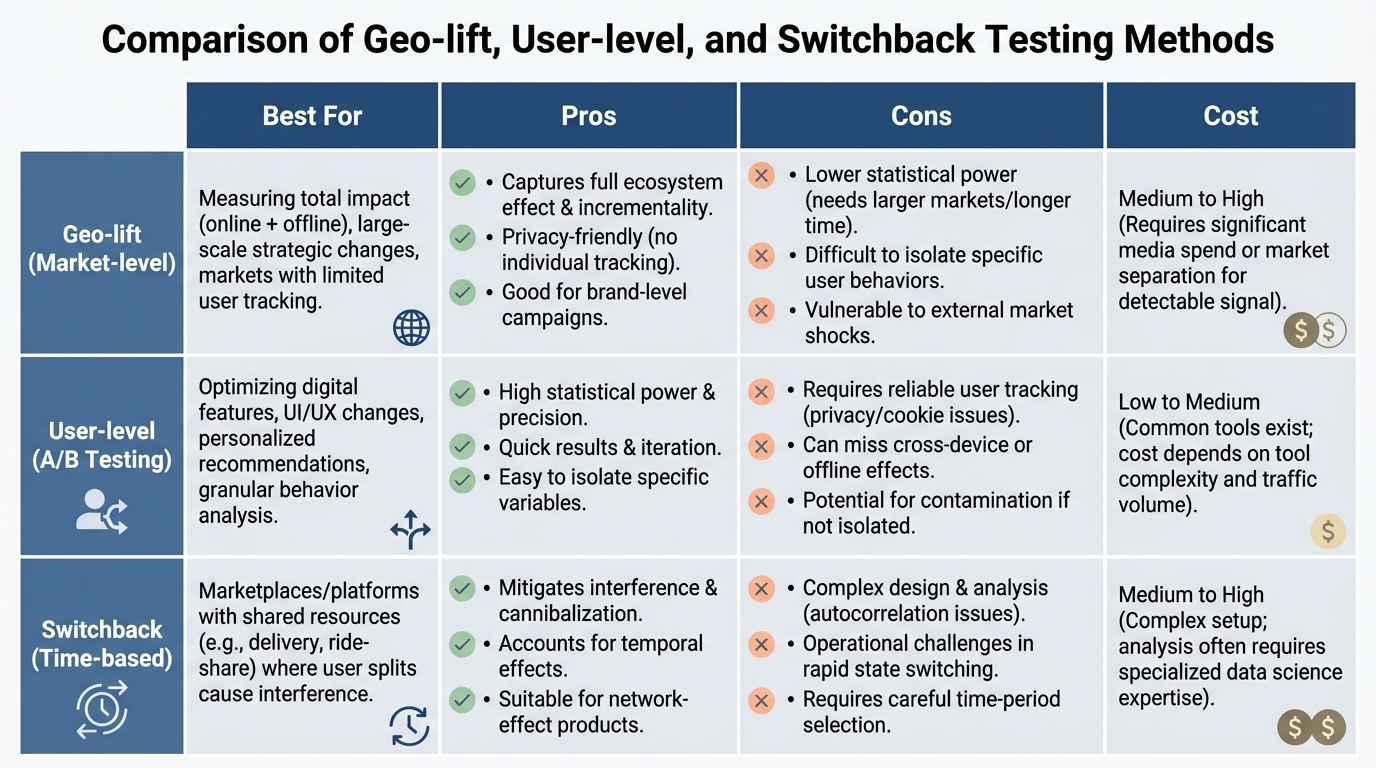
1. Geo-Lift Experiments (The Gold Standard)
Geo-testing involves holding out specific geographic regions (cities, states, or DMAs) from receiving advertising while keeping others active.
- How it works: You identify two groups of markets that historically trend together (e.g., Kansas City and Indianapolis). You keep ads running in Kansas City (Test) and turn them off in Indianapolis (Control).
- Best for: Channels where user-level tracking is impossible, such as TV, radio, or billboards. It is also essential for validating Out-of-Home advertising performance.
- Pros: Privacy-safe (no cookies needed), captures cross-device impact, works for walled gardens.
- Cons: Requires holding back budget (opportunity cost), can be expensive to run.
According to research published by Harvard Business Review, randomized controlled experiments (like geo-lift) are often the only reliable way to measure the effectiveness of advertising where direct causal links are hard to see.
2. User-Level (Audience Split) Tests
Platforms like Meta and Google offer native "Lift Studies." They split your audience into two groups based on user IDs.
- How it works: The platform randomizes who sees your ad. Group A sees your brand ad. Group B sees a "ghost ad" (nothing) or a placebo ad.
- Best for: High-volume digital channels (Facebook, YouTube, TikTok).
- Pros: Easy to set up, free (usually), high statistical power.
- Cons: You must trust the platform's math ("grading their own homework"), doesn't account for cross-channel pollution.
3. Switchback Testing (Time-Based)
You turn ads on and off during specific time windows (e.g., On for 2 hours, Off for 2 hours).
- Best for: High-velocity marketplaces (Uber, DoorDash) or high-traffic e-commerce.
- Pros: Fast results.
- Cons: Vulnerable to time-based anomalies and carry-over effects.
[IMAGE: Comparison table of Geo-lift, User-level, and Switchback testing methods. Columns for "Best For", "Pros", "Cons", and "Cost".]
Alt text: Table comparing different marketing incrementality testing methodologies.
!Table comparing different marketing incrementality testing methodologies.*
Executing a test requires discipline. A poorly designed test yields bad data, which is worse than no data.
Step 1: Formulate a Hypothesis
Don't just "test Facebook." Be specific.
Bad:* "Is YouTube working?"
Good:* "Does investing $50k/month in YouTube prospecting drive incremental new customer acquisition, or does it cannibalize Search?"
Step 2: Define Your Variables
- Test Group: The audience/geo seeing the ads.
- Control Group: The audience/geo NOT seeing the ads.
- KPI: What are you measuring? (Revenue, Orders, App Installs).
- Duration: Usually 4-6 weeks to account for sales cycles.
Step 3: Determine Sample Size and Budget
You need enough data to reach statistical significance. If your conversion volume is low, you need a larger change in spend to detect the signal.
Budgeting for tests is often tricky. You are essentially paying to not advertise to some people to learn a lesson. For strategies on how to carve this out of your P&L, refer to our media budget optimization guide.
Step 4: Execute and Monitor (Do Not Touch!)
Once the test starts, do not change the settings. Don't optimize creatives. Don't change bids. Don't panic if sales dip in the holdout group (that's the point). Pollution invalidates the test.
Step 5: Analyze the Lift
Calculate the difference between the Test and Control groups.
- Incremental ROAS (iROAS): (Revenue in Test - Revenue in Control) / Ad Spend.
- Lift %: (Test Conversion Rate - Control Conversion Rate) / Control Conversion Rate.
If your platform ROAS is 4.0 but your iROAS is 0.5, you are losing money on every sale.
The Role of Media Mix Modeling (MMM)
Incrementality tests are snapshots in time. You cannot run a holdout test on every channel, every day, forever. It’s too expensive and kills growth.
This is where Media Mix Modeling (MMM) comes in.
MMM uses historical data to model the relationship between spend and revenue. However, MMM needs calibration. Without ground-truth data, MMM is just a sophisticated guess.
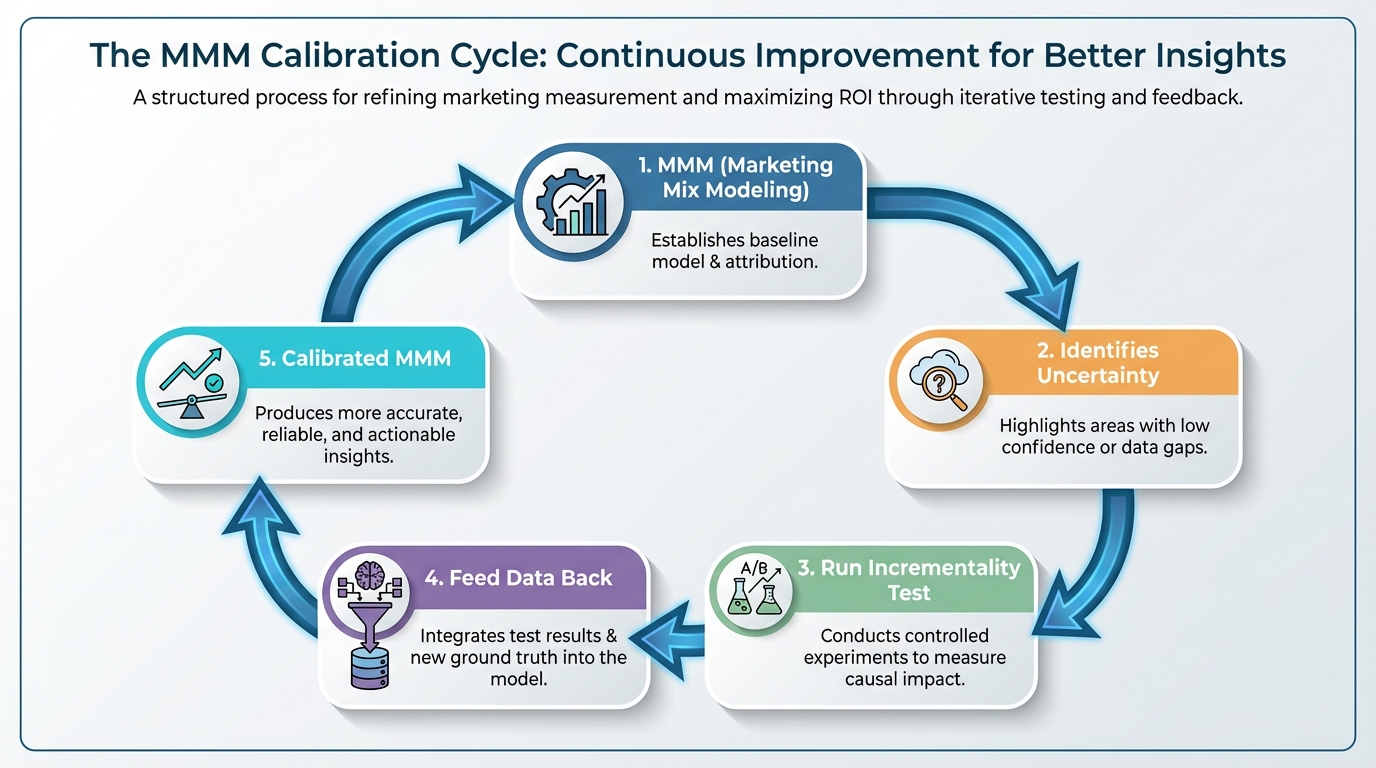
The Winning Workflow:
- Run MMM to get a baseline reading of channel performance.
- Identify channels with high uncertainty (wide confidence intervals).
- Run an incrementality test on those specific channels.
- Feed the test results back into the MMM as a "prior."
- The MMM updates its coefficients, becoming more accurate.
This feedback loop is critical. This is where BlueAlpha changes the game. Instead of a 6-week manual analysis cycle, BlueAlpha automates this calibration process, ingesting lift test data to refine your models instantly while maintaining statistical rigor.
For a deeper dive on how these models function, read our guide on media mix model marketing attribution.
[IMAGE: Cycle diagram showing MMM -> Identifies Uncertainty -> Run Incrementality Test -> Feed Data Back -> Calibrated MMM.]
Alt text: The feedback loop between Media Mix Modeling and Incrementality Testing.
Caption: Incrementality testing validates MMM, making your ongoing measurement sharper.
!The feedback loop between Media Mix Modeling and Incrementality Testing.*
Data interpretation is where marketers get cold feet.
Let's say you ran a geo-lift test on TikTok.
- Platform reported: $100k revenue.
- Test results showed: $20k incremental revenue.
- Spend: $25k.
Platform ROAS: 4.0 ($100k / $25k).
Incremental ROAS: 0.8 ($20k / $25k).
Conclusion: You lost money. The platform claimed credit for organic sales.
Action: You don't necessarily kill the channel. You might reduce spend, change the creative focus from retargeting to broad prospecting, or adjust your bid cap.
Understanding the nuance of ROI is complex. We break down the financial modeling in our marketing ROI analysis guide.
Statistical Significance
You will often see a "p-value" in your results. A p-value < 0.05 means there is a 95% chance the result is real and not random noise.
According to the Netflix Tech Blog, ignoring statistical significance in A/B testing is the primary reason for false positives in product decisions. The same applies to marketing. If your lift isn't significant, don't treat it as fact.
You can learn more about the basics of significance testing from the Khan Academy statistics resources.
Advanced Applications
Once you master the basics, you can apply incrementality to harder-to-measure areas.
Account-Based Marketing (ABM)
In B2B, sales cycles are long. A simple "click" attribution doesn't capture the influence of a whitepaper download six months ago. You can run holdout tests on specific target account lists to measure pipeline velocity.
Related:* Account-based marketing attribution guide.
Influencer Marketing
Influencers are notoriously hard to track. Promo codes leak to coupon sites, messing up attribution. Geo-testing is often the best way to measure a large influencer campaign. Isolate the region where the influencer has the highest density (if known) or run a time-based switchback during their main posting window.
Related:* Influencer marketing performance measurement guide.
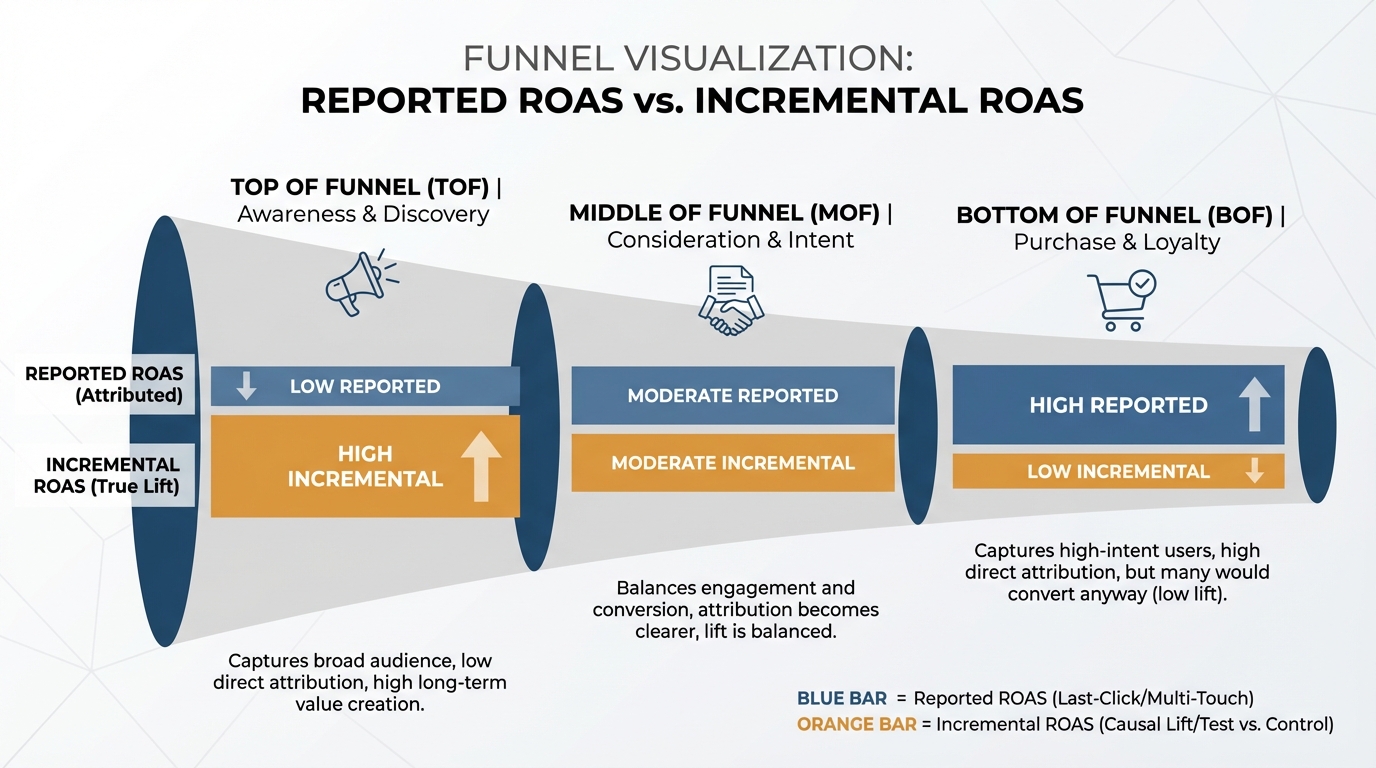
Funnel Stage Budgeting
Should you spend more on Top of Funnel (TOF) or Bottom of Funnel (BOF)? Platforms always push BOF because it converts easily. Incrementality usually reveals that TOF has higher incremental value because it brings in net-new customers.
Related:* Funnel stage budget allocation guide.
[IMAGE: Funnel visualization showing "Reported ROAS" vs "Incremental ROAS" at different stages. TOF usually has low reported/high incremental. BOF has high reported/low incremental.]
Alt text: Marketing funnel comparing reported ROAS versus incremental ROAS at awareness and conversion stages.
Caption: Retargeting often claims credit for sales that would have happened anyway.
You can run these tests manually using Excel and Python, but it’s painful. Dedicated platforms make it easier.
Open Source & DIY
If you have a data science team, you can use libraries like Google's CausalImpact or Meta's Robyn. These require significant technical overhead.
- Google CausalImpact: An R package for causal inference using Bayesian structural time-series models. You can access the code on Google's CausalImpact GitHub.
- Meta Robyn: An experimental, automated marketing mix modeling (MMM) code. Check out the Meta Robyn documentation.
For a complete breakdown of these tools, read our Meta Robyn open source MMM guide or our Google Meridian MMM complete guide.
SaaS Solutions
Several platforms specialize in incrementality and MMM. While tools like Measured and Recast offer specific features, BlueAlpha provides a more unified approach.
- Measured: Known for geo-testing capabilities. See how they stack up in our Measured.com vs BlueAlpha comparison.
- Recast: Focuses on MMM with calibration features. Read our full Recast vs BlueAlpha comparison.
- Keen Decision Systems: Another player in the space. Check the Keen Decision Systems vs BlueAlpha breakdown.
BlueAlpha distinguishes itself by unifying the MMM and incrementality workflow. It allows you to not just measure, but forecast future scenarios based on validated data, effectively closing the loop between testing and strategy.
Common Pitfalls to Avoid
Even smart marketers mess this up. Avoid these traps:
- Testing During Peak Seasonality: Don't run a holdout test during Black Friday. The noise will drown out the signal.
- Cross-Contamination: If you turn off Facebook Ads in Ohio, but keep YouTube Ads running, and your YouTube ads are retargeting people who saw Facebook ads... your data is dirty.
- Impatience: Ending a test early because "it looks like it's winning" breaks the statistical validity.
- Ignoring Margins: Revenue lift is good. Profit lift is better. Always calculate based on margin contribution.
For a broader look at selecting the right model to avoid these issues, review our media mix modeling comparison.
FAQ
Q: How much budget do I need for an incrementality test?
A: It depends on your conversion rate, but generally, you need at least 50-100 conversions per week in your control group to reach significance. For many brands, this means dedicating 10-20% of the channel budget to the test.
Q: Can I run incrementality tests on TV?
A: Yes, via geo-lift. You blackout specific regions and measure the sales dip compared to regions where TV ads continued.
Q: How often should I test?
A: You should test quarterly for major channels (Google/Meta) and annually for emerging channels. Continuous testing is ideal but operationally difficult without automated tools like BlueAlpha.
Q: What is a good iROAS?
A: An iROAS above 1.0 means you are breaking even on ad spend. However, you need to factor in COGS. If your margin is 50%, you need an iROAS of 2.0 to break even on profit.
Q: What is the difference between incrementality testing and A/B testing?
A: A/B testing compares two versions of an asset (Creative A vs Creative B) to see which performs better. Incrementality testing compares an asset against nothing (Ad vs No Ad) to see if the asset drives value at all.
Q: How do I convince my CFO to invest in incrementality testing?
A: Speak their language. Explain that current reporting (ROAS) is likely overstating revenue. Incrementality testing is risk mitigation—it ensures capital is deployed efficiently and prevents "waste spend" on organic conversions.
Conclusion
Incrementality testing is the antidote to vanity metrics. It forces you to confront the reality of your marketing spend.
It might be painful to learn that your favorite channel isn't performing as well as you thought. But that pain is necessary. It frees up budget to be deployed where it actually drives growth.
Don't settle for "attributed" revenue. Demand incremental growth.
Start small. Pick one channel. Run a geo-test. Validate your MMM. If you need a platform that handles the heavy math of triangulation for you, BlueAlpha is built to bridge the gap between modeling and testing.
Ready to stop guessing? Book a demo with BlueAlpha to see how triangulated measurement can validate your channel performance in 30 days.
Ready to deploy a more accurate measurement strategy? Check out our guide on how to deploy a media mix model to get started.