Geo Experiments MMM: Calibrating Marketing Models
Stop guessing with your marketing data. Learn how to use geo experiments MMM calibration to validate incremental lift and maximize ROI. Read the guide.

Marketing data is messy. You have tracking pixels blocked by browsers, walled gardens hoarding data, and customer journeys that look more like spaghetti than a funnel. To make sense of it, you likely turned to Media Mix Modeling (MMM). It’s the gold standard for understanding high-level performance without relying on cookies.
But without geo experiments MMM calibration, your model might be misleading you.
MMM is correlational. It looks at historical spikes in spend and sales and draws a line between them. Sometimes, that line is wrong. Maybe you ran a huge TV campaign the same week a competitor went out of business. The model might give credit to the TV ad when the sales actually came from the market vacuum.
This is where calibration comes in.
Geo experiments are the "truth serum" for your statistical models. By running controlled lift tests in specific geographic regions, you generate hard proof of causality. You then feed that proof back into your model to correct its assumptions.
If you aren't calibrating your MMM with lift testing, you aren't modeling. You're guessing with math.
The Trust Gap in Marketing Measurement
We are moving away from the era of multi-touch attribution (MTA). The privacy landscape has crumbled the cookies that MTA relied on. This shift has pushed marketers toward probabilistic methods.
However, moving from deterministic tracking (clicking a link) to probabilistic modeling (MMM) creates a trust gap. CFOs like hard numbers. When a model says, "We think Facebook drove $1M in revenue," the immediate question is, "How do you know?"
Without calibration, you don't.
Correlation vs. Causation
Standard regression models find patterns. If ice cream sales and shark attacks both go up in July, a basic model might suggest buying ice cream causes shark attacks. We know the hidden variable is "summer weather."
In marketing, these variables are harder to spot. Did the YouTube ads drive sales, or was it the email blast sent the same day?
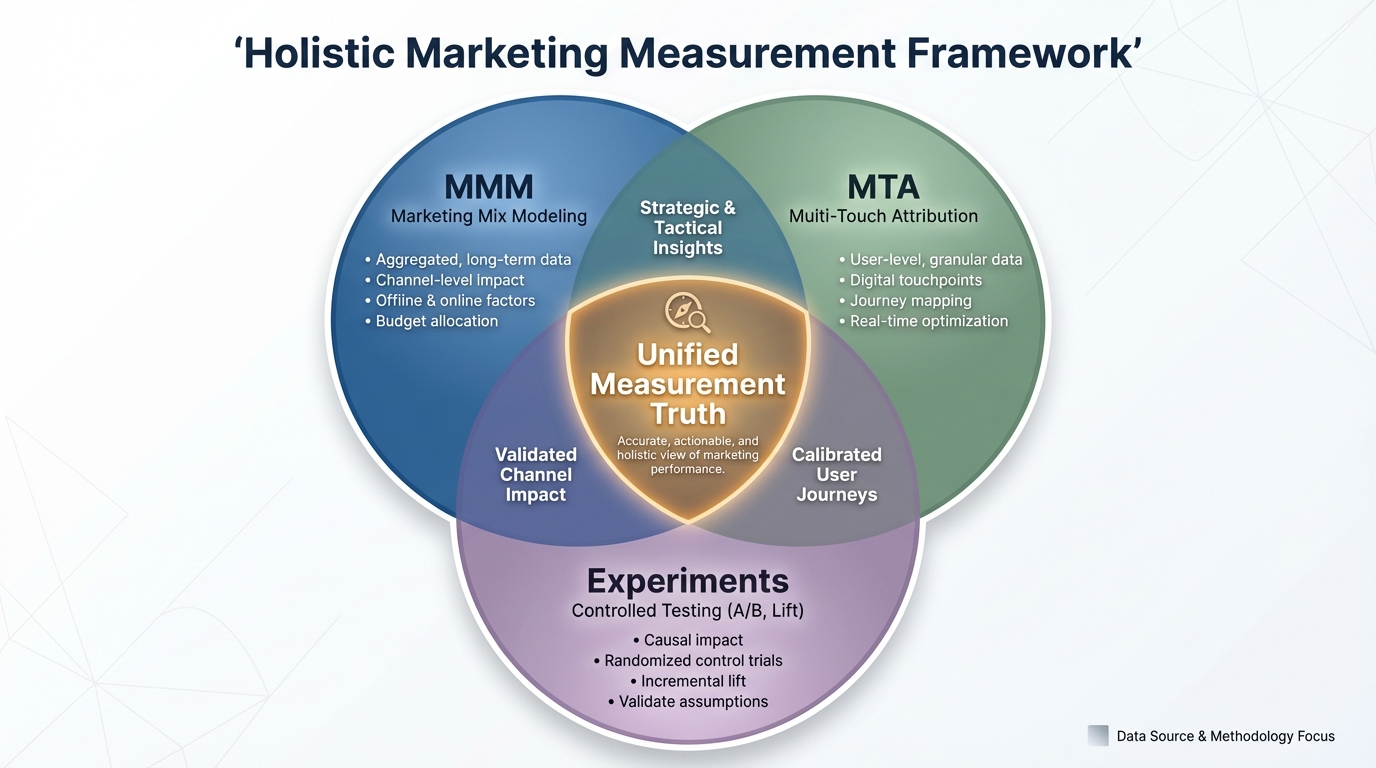
To bridge this gap, you need a comprehensive strategy. A solid media mix model marketing attribution guide will tell you that triangulation is key. You cannot rely on one methodology alone.
What Are Geo Experiments?
A geo experiment is a form of A/B testing where the "buckets" are geographic regions rather than individual users.
You split the country (or your target market) into two groups:
- Control Group: These regions see business as usual.
- Treatment Group: These regions get a change in ad spend (either a "heavy up" or a "blackout").
By comparing the sales lift (or drop) in the Treatment regions against the baseline of the Control regions, you calculate the incremental impact of that specific channel.
This is pure causal data. You pulled a lever in Region A and didn't in Region B. If Region A went up, the lever worked. This methodology is often backed by rigorous statistical packages like Google's CausalImpact, which uses Bayesian structural time-series models to infer impact.
Why Not Just Use Lift Tests?
If geo experiments are so accurate, why bother with MMM? Why not just test everything?
Because testing is expensive and slow. You cannot run a geo lift test on every channel, every week, forever. You would bankrupt your media budget and pollute your data.
This is why we compare MTA vs MMM marketing attribution. Each has strengths. MMM gives you the broad, always-on view. Geo experiments give you the specific, periodic validation points.
The Calibration Loop: Integrating Lift into MMM
This is the technical heart of the strategy. You don't just run a test, read the PDF report, and high-five your team. You must mathematically integrate that result into your model.
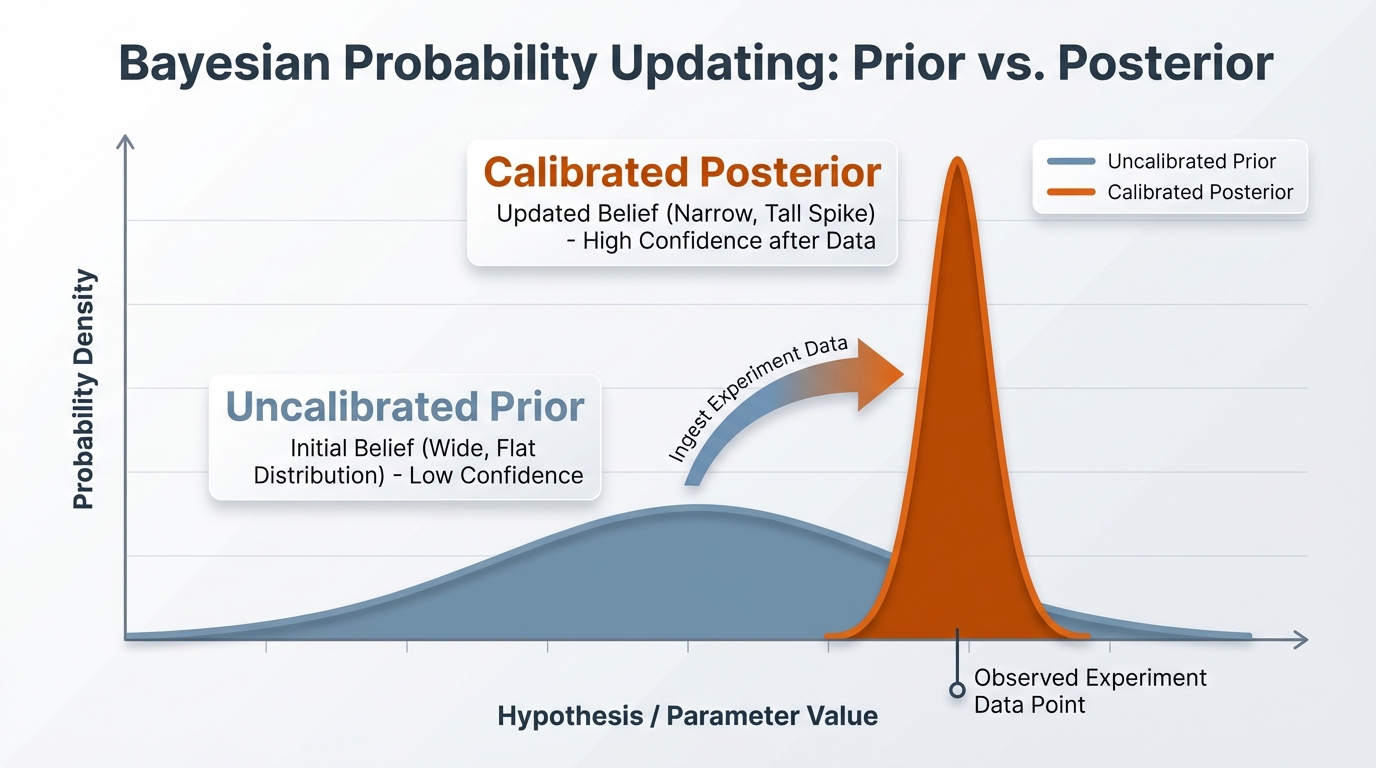
Most modern MMMs use Bayesian statistics. In a Bayesian model, you start with a "prior"—a belief about how a channel performs. The model then looks at the data to update that belief.
Geo experiments MMM calibration works by tightening those priors.
- The Initial Guess: Your MMM thinks TikTok ROAS is somewhere between 1.0 and 5.0. That is a wide range.
- The Experiment: You run a geo lift test on TikTok. The result says the incremental ROAS is 2.8.
- The Calibration: You tell the MMM, "I have strong evidence that TikTok is near 2.8."
- The Result: The model updates. It might now estimate TikTok ROAS between 2.6 and 3.0.
This reduces uncertainty. The model fits the rest of the data around this anchor point of truth. According to Stanford's Encyclopedia of Philosophy, this process of updating probabilities based on new evidence is the fundamental advantage of Bayesian reasoning over frequentist methods.
[IMAGE: A graph showing a Bayesian probability curve. A wide, flat curve represents 'Uncalibrated Prior'. A narrow, tall spike represents 'Calibrated Posterior' after ingesting experiment data.]
For a deeper dive on how effectiveness is calculated across different methodologies, review our marketing effectiveness measurement guide.
Step-by-Step: Running Your First Calibration Test
You don't need a PhD to run these, but you do need rigor. A sloppy experiment is worse than no experiment because it gives you false confidence.
Phase 1: Design and Market Selection
You cannot just pick New York as your test and North Dakota as your control. They behave differently. You need "matched markets."
You look for regions that have historically correlated sales trends. Maybe Chicago and Philadelphia sales move in lockstep. You can separate them.
Tools like Google Meridian MMM often have built-in modules to help select these regions, but you can also do it with Python or R.
Phase 2: The Intervention
Decide on your tactic:
- Holdout (Blackout): Turn off ads in the test region. Measure the drop in sales. This is the cleanest method but costs you revenue.
- Heavy Up (Scale): Double the spend in the test region. Measure the lift. This costs media budget but protects revenue.
Ensure the test runs long enough to capture the purchase cycle. If you sell cars, a one-week test is useless.
Phase 3: Analyzing Incremental Lift
Once the test ends, you calculate the difference between the actual sales in the test region and the predicted sales (based on the control region).
This delta is your incremental lift.
According to Harvard Business Review, companies that run consistent business experiments can see significant efficiency gains by identifying what actually drives value versus what just correlates with it. The math pays off.
Phase 4: Ingestion
This is where platforms like BlueAlpha shine. BlueAlpha’s automated calibration workflow lets teams input experiment results (e.g., "Facebook Lift = 15%") directly into the platform, updating model outputs within hours rather than weeks. The system rebuilds the model using this constraint.
If you are manually coding this, you would update the priors in your code (like in Meta Robyn open source MMM) to reflect the mean and standard deviation of your test result.
Nuances by Channel
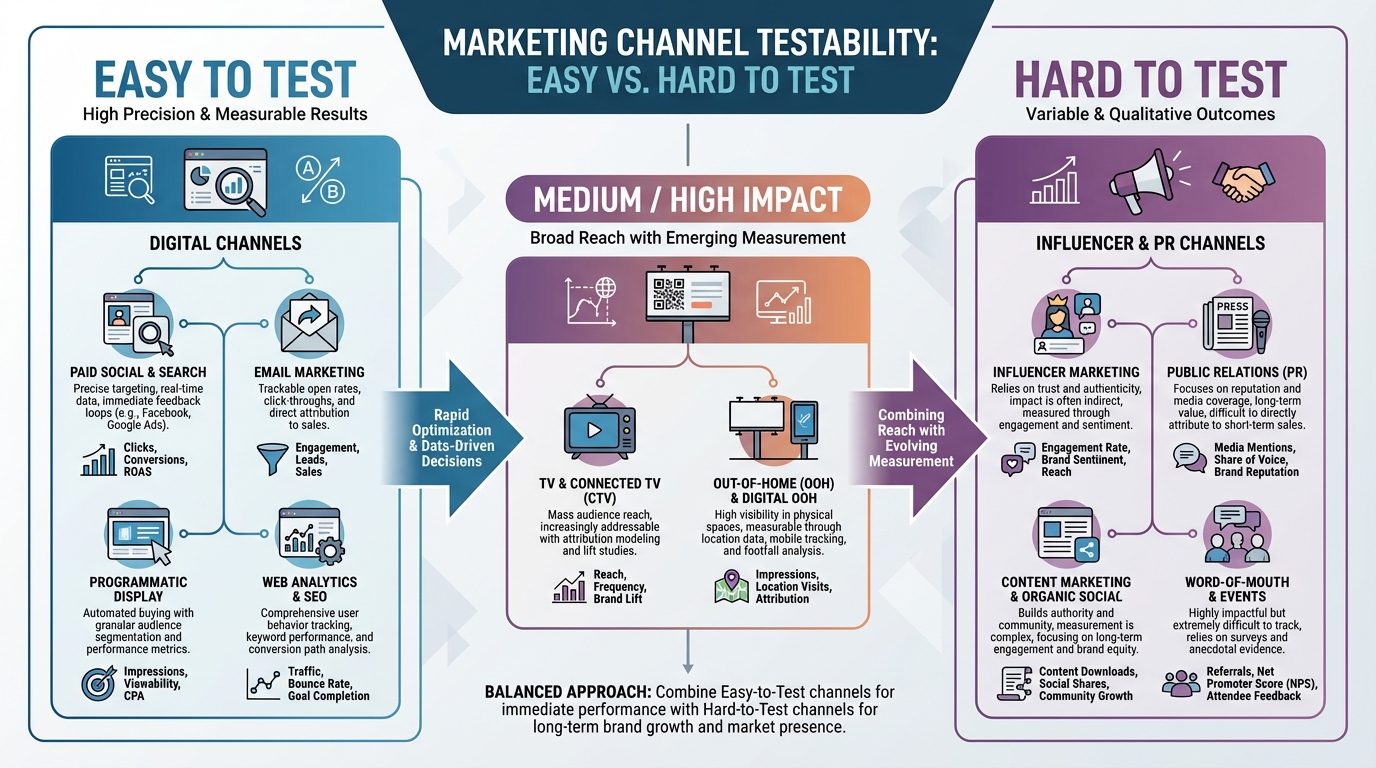
Not all channels are easy to test.
Digital and Social
Platforms like Meta and YouTube allow precise geo-targeting. It is easy to exclude a specific DMA (Designated Market Area). However, you must be careful of "leakage"—where a user in a control region sees an ad because their IP address puts them in the wrong place.
Out of Home (OOH)
OOH is actually perfect for geo experiments MMM calibration. You cannot click a billboard, so MMM is often the only way to measure it. Turning off billboards in Denver while keeping them in Seattle provides a very clean signal. Nielsen reports that granular geographic data is essential for validating these offline channels.
For more specifics on offline tracking, check the out of home advertising tracking guide.
Account Based Marketing (ABM)
B2B is trickier because of low volume. Geo testing might not work if you only have 50 target accounts in a region. In this case, you might look at account-level holdouts rather than geographic ones.
Read more on this in our account based marketing attribution guide.
Common Pitfalls to Avoid
Even smart data teams mess this up. Here are the traps.
1. Seasonality Contamination
Did you run your "Heavy Up" test during Black Friday? If so, your results are garbage. You cannot separate the ad impact from the holiday shopping frenzy. Always test during stable periods. McKinsey highlights that accounting for seasonality is critical for accurate performance management.
2. Insufficient Budget Delta
If you increase spend by 10%, you might not see a statistically significant result. You usually need a "shock" to the system—think +50% or +100% spend in that region—to cut through the noise.
3. Ignoring the Funnel
A top-of-funnel brand campaign might not drive immediate sales. If your test measures immediate conversion, you will undervalue the brand work. You need to align your metric with the campaign goal.
See our funnel stage budget allocation guide to understand how different stages require different measurement windows.
The Tech Stack: How to Operationalize This
You can do this in spreadsheets, but it is painful. Modern marketing requires agility. You need a stack that automates the data collection, modeling, and calibration loop.
The "Build it Yourself" Route
You can use open-source libraries. This gives you total control but requires a team of data scientists to maintain. You'll spend more time fixing code than analyzing strategy. If you choose this path, you must understand the technical requirements detailed in our how to deploy media mix model article.
The Platform Route
Dedicated platforms handle the heavy lifting. They ingest data from connectors, run the Bayesian regressions, and provide fields to input lift test results.
For example, when looking at Measured.com vs BlueAlpha AI, you'll see different approaches to how lift data is handled. Some platforms force you into their proprietary testing methodology, while others (like BlueAlpha) are agnostic, letting you import results from any test source.
Similarly, if you are comparing Recast vs BlueAlpha comparison, pay attention to how quickly the model updates after a calibration event. Speed matters when you are trying to optimize in-quarter.
Other tools focus heavily on the visualization aspect. A Northbeam vs BlueAlpha AI comparison highlights the difference between attribution dashboards (Northbeam) and true causal modeling environments.
Validating ROI with Calibrated MMM
The ultimate goal of geo experiments MMM strategies is to prove ROI.
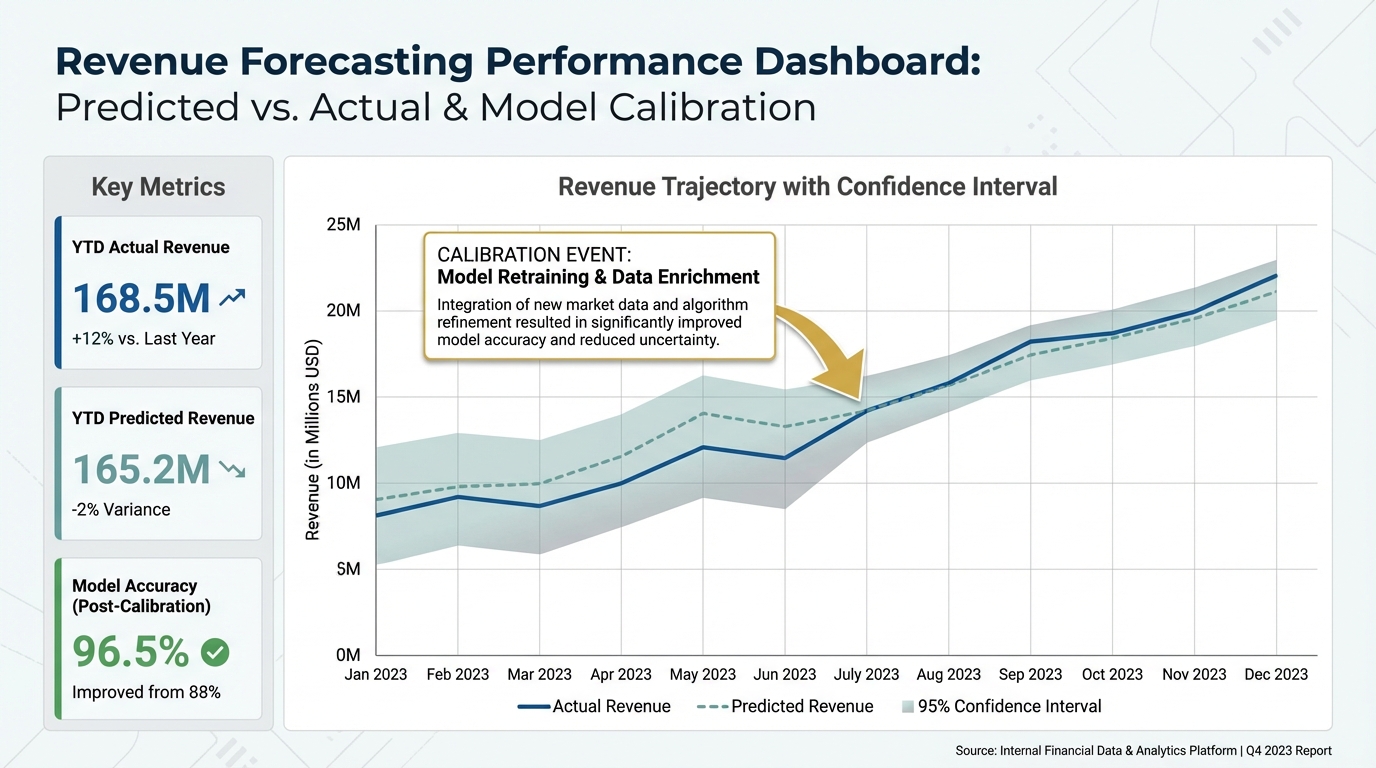
Uncalibrated models often overestimate ROI because they claim credit for organic sales. Calibrated models are usually more conservative—and more accurate. According to Gartner's marketing data analysis, the ability to prove incremental value is the primary factor in securing future budget from finance teams.
When you present a calibrated ROI to your board, you can defend it.
"We know the ROI is 3.5x because the model says so, and we validated that model with a holdout test in Texas last month."
That statement ends arguments.
For a complete framework on calculating returns, refer to our marketing ROI analysis guide.
[IMAGE: Dashboard view showing 'Predicted Revenue' vs 'Actual Revenue' with a confidence interval shaded area. A specific annotation points to a 'Calibration Event' where the model accuracy improves.]
Advanced: Calibrating for Influencers
Influencer marketing is notoriously hard to track. Promo codes leak to coupon sites, and views don't always equal clicks.
Geo-testing is a solution here. You hire influencers who have a predominantly specific regional audience (hard to find, but possible) or you coordinate a blast of influencers to all promote a specific regional offer.
If you are struggling with creator metrics, read the influencer marketing performance measurement guide.
Once you have your calibrated model, the next step is acting on it. You can move funds confidently using the insights found in our media budget optimization guide.
Conclusion: Confidence is the New Currency
Data volume is no longer the differentiator. Everyone has data. The differentiator is confidence in that data.
Geo experiments provide the ground truth. MMM provides the scale. Together, they create a measurement framework that can survive privacy changes, cookie deprecation, and CFO scrutiny.
Don't just model. Calibrate.
Frequently Asked Questions (FAQ)
Q: How often should I run geo experiments for MMM calibration?
A: Ideally, you should test your major channels quarterly. For smaller or stable channels, twice a year is sufficient. The goal is to catch changes in channel effectiveness or market dynamics.
Q: Can I run geo experiments with a small budget?
A: It is difficult. To get statistical significance, you usually need enough transaction volume to spot the difference between the control and treatment groups. If you have fewer than 100 conversions per region per month, geo testing might yield inconclusive results.
Q: What is the difference between Lift Studies and Geo Experiments?
A: "Lift Studies" often refers to platform-specific tests (like a Facebook Conversion Lift study) that use user-level holdouts (Ghost Ads). "Geo Experiments" use geographic regions. Geo experiments are generally more robust because they capture the full effect of the channel, including word-of-mouth and cross-device behavior, which user-level tracking misses.
Q: Do I need a data scientist to run a geo experiment?
A: To design it manually, yes. You need to calculate power analysis, select matched markets, and analyze causal impact. However, using platforms like BlueAlpha or other Lifesight alternatives marketing measurement platforms can automate the complex math for you.
Q: How do I handle external factors like a competitor launching a product during my test?
A: This is why you use a Control group. If a competitor launches nationally, sales should drop in both your Control and Treatment regions. The difference (delta) between the two regions should still isolate your ad impact. However, if the competitor only launches in your Treatment region, the test is invalid.