Blended CAC Can Lead to a Bad Cost Decision
Calculate blended CAC, compare it with paid, fully loaded, and incremental CAC, and use each metric for the right growth decision.
Blended CAC measures the average marketing cost to acquire a customer across all channels. While corporate leaders rely on it for financial updates, blended customer acquisition cost often hides unprofitable ad spend. It combines paid ads with organic traffic, which flatters weak ad campaigns. It also frequently counts returning buyers as new buyers. When marketing teams scale campaigns based on an aggregated blended figure, they risk spending money on ads that do not produce incremental sales.
To make good budget decisions, teams must audit the spend in the numerator and the buyers in the denominator. You must separate baseline demand from paid acquisition before you increase your marketing budget.
Formula
The basic CAC formula divides total marketing spend by the total number of customers gained in a time period:
$$\text{Blended CAC} = \frac{\text{Total Marketing Expenditures}}{\text{Total Customers Acquired}}$$
Marketing leaders often calculate this metric every month or quarter. A basic calculation looks simple, but the raw numbers hide critical differences. For example, if you spend $100,000 on marketing and report 2,000 customers, your blended acquisition cost is $50.
$100,000 Total Marketing Spend / 2,000 Total Customers = $50 Blended CAC
This top-line calculation treats every customer as an equal product of that $100,000 budget. It ignores whether a buyer clicked an ad, searched your brand name directly, or bought from your store three times before. For strategic planning, teams pair this metric with a macro portfolio analysis. For example, see our guide on ROAS vs MER to observe macro revenue trends against total ad investment.
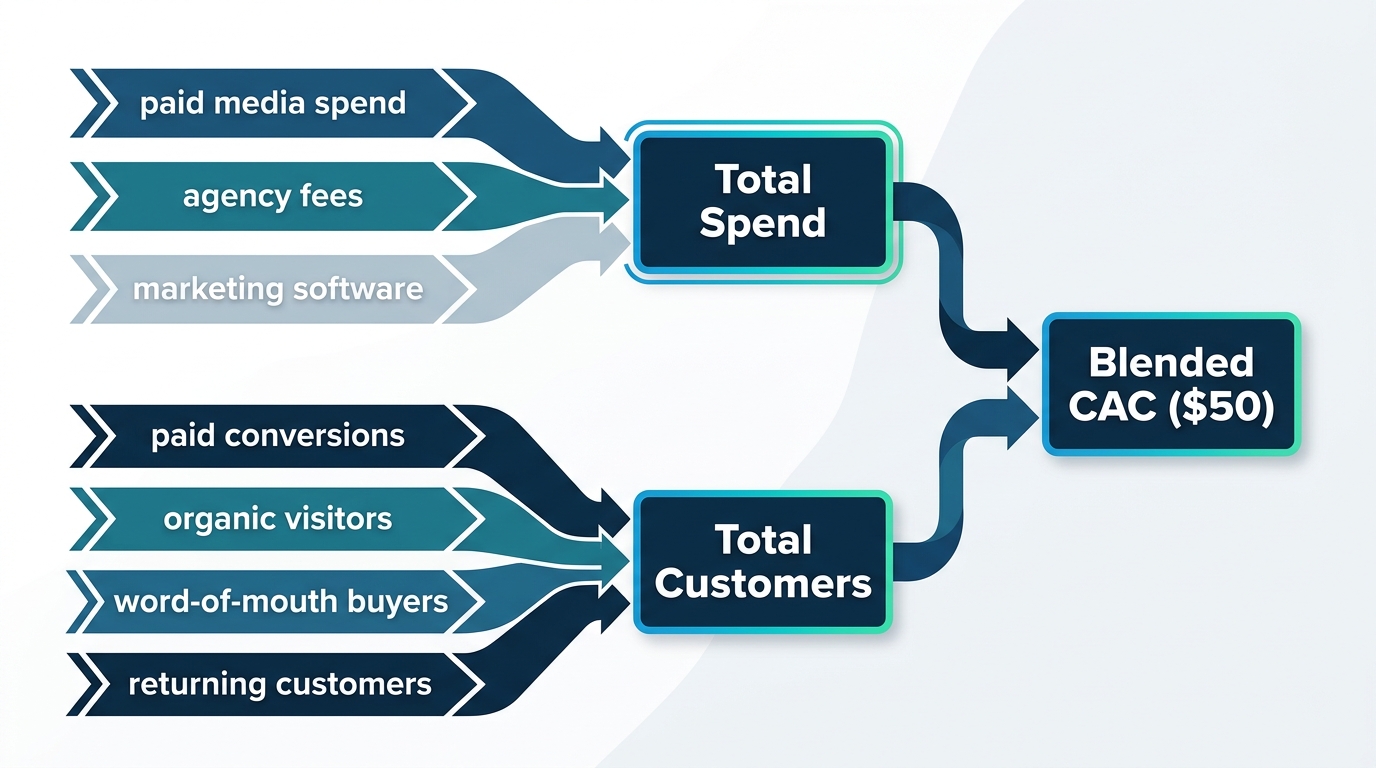
Cost and Customer Scope
Teams calculate acquisition efficiency incorrectly when they do not define the scope of the numerator and denominator. Financial analysts and growth operators often disagree because they track different inputs under the same metric name.
As detailed in QRY's unit economics guide, an accurate acquisition model requires clear boundaries for costs and customer definitions:
                          ┌─────────────────────────────┐
                          │   Total Marketing Spend     │
                          │ (Media, Salaries, Software) │
                          └──────────────┬──────────────┘
                                         │
                                         ▼
                 ┌──────────────────────────────────────────────┐
                 │          Customer Scope Selector             │
                 └───────┬──────────────────────────────┬───────┘
                         │                              │
                         ▼                              ▼
              [ All Orders / Buyers ]        [ New Customers Only ]
                         │                              │
                         ▼                              ▼
                 Artificially Low CAC            Accurate Unit CAC
                 (Distorts Economics)          (Reflects Growth Cost)
Defining the Numerator: Paid Media vs Fully Loaded Costs
The numerator can show direct variable costs or total company overhead.
- Variable Paid Media Spend: This scope counts only gross ad spend across digital platforms like Meta, Google, and TikTok. Growth teams prefer this scope to make daily bid adjustments.
- Fully Loaded CAC: This scope adds agency fees, marketing software subscriptions, creative production costs, and internal team salaries to the ad spend. As documented by Exactius's growth library, excluding these overhead expenses causes companies to underestimate true acquisition costs. Diligence teams and CFOs require this fully loaded number to calculate long-term cash runways.
Defining the Denominator: Total Orders vs New Customers
The denominator causes the most dangerous errors in unit economics.
- Total Transactions: Some teams divide spend by total orders placed in an e-commerce platform. This error credits marketing for repeat orders from loyal customers.
- New Customer CAC: This scope removes all returning buyers from the denominator. It counts only first-time buyers with unique identities in your CRM or order database.
If your customer database does not isolate first-time purchasers, your calculated unit cost understates reality. Consider a store with a $50,000 budget, 1,000 new customers, and 1,000 repeat orders. Its true new customer CAC is $50, not $25.
Blended vs Paid vs Incremental CAC
Marketers use different variations of customer acquisition cost to solve specific measurement problems. You must understand how these variations interact to avoid misallocating capital.
| Metric Type | Formula | Best Use Case | Primary Limitation |
|---|---|---|---|
| Blended CAC | Total Spend / All New Customers | Board reporting and macro financial health | Hides unprofitable ad spend behind organic demand |
| Paid CAC | Paid Ad Spend / Paid-Attributed New Customers | Channel-level tactical optimization | Relies on click-based attribution models that miss user paths |
| Incremental CAC | Paid Ad Spend / Lift-Tested Incremental Customers | Strategic budget allocation and scale decisions | Requires controlled experiments and holdout groups |
Paid CAC vs Blended CAC
Paid CAC narrows the focus. It divides direct paid advertising dollars exclusively by the customers attributed to those paid ads:
$$\text{Paid CAC} = \frac{\text{Paid Ad Spend}}{\text{New Customers Attributed to Paid Media}}$$
As shown in MixedMetrics' blended CAC analysis, paid CAC is almost always higher than blended CAC. Blended figures dilute costs across unpaid channels like organic search, direct brand navigation, word-of-mouth referrals, and unpaid social media.
Tracking both metrics helps evaluate your organic strength. If your paid CAC rises while your blended CAC remains flat, your organic acquisition engine subsidizes inefficient digital campaigns.
Review these dynamics alongside established paid media KPIs. This practice prevents you from scaling an ad channel that cannot succeed alone.
Incremental CAC
Incremental CAC provides the most accurate view of marketing efficiency. Digital ad platforms use multi-touch attribution or click trackers to take credit for conversions. However, attribution models often award credit to ads viewed by users who intended to buy anyway.
$$\text{Incremental CAC} = \frac{\text{Paid Ad Spend}}{\text{Incremental New Customers from Lift Testing}}$$
According to measurement analyses by Hawke Media, unadjusted CAC calculations can diverge by 30 percent or more from real performance. This error happens because standard metrics do not measure incrementality. Incrementality measures the true lift that an ad creates above baseline organic sales.
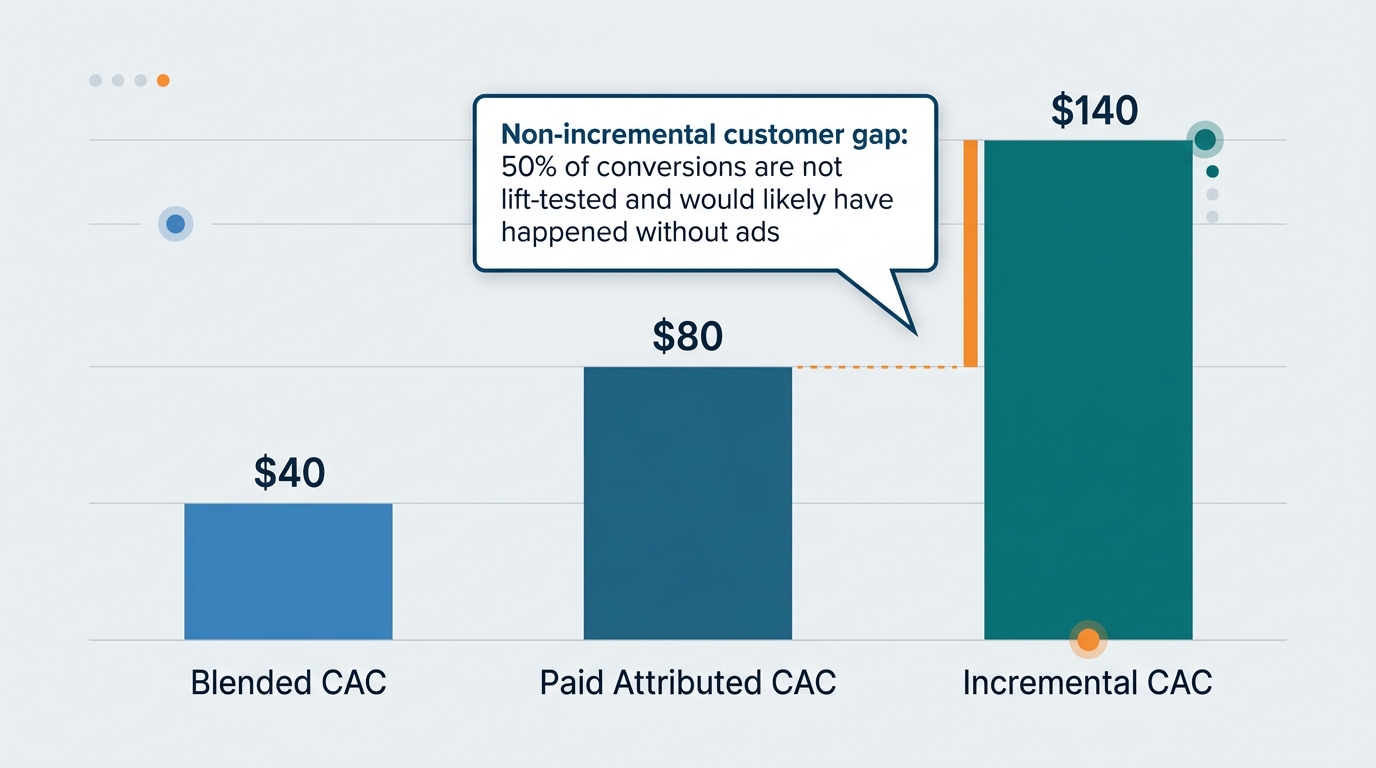
To find true incrementality, you must execute controlled geo-lift tests or media holdout tests. Turn off branded search ads in five target regions. If customer acquisition volumes remain identical, those search ads generate zero incremental lift. An attributed Paid CAC of $20 on that channel masks an infinite true acquisition cost.
Worked Example
To see how blended metrics mask operational risks, consider the quarterly performance of a direct-to-consumer brand.
In this scenario, the brand spends $120,000 on digital acquisition channels over 90 days. The store logs 2,400 total transactions during this period.
Total Marketing Outlay: $120,000
Total Recorded Transactions: 2,400
First-Time Paying Customers: 1,200
Repeat Orders from Existing Customers: 1,200
First-Time Buyers Attributed to Paid Ads: 800
First-Time Buyers from Organic/Direct Channels: 400
Incrementality Factor on Paid Ads (from Geo-Lift Test): 60%
The Misleading Surface Calculation
If the company mistakenly divides its budget by total transactions, the acquisition cost appears low:
$$\text{Flawed Order CAC} = \frac{$120,000}{2,400} = $50$$
If the team corrects the denominator to isolate the 1,200 real first-time buyers, the metric doubles:
$$\text{Reported Blended CAC} = \frac{$120,000}{1,200} = $100$$
The Paid Channel Reality
Next, the marketing team calculates its Paid CAC. They isolate the 800 new buyers attributed to digital campaigns through ad platform tracking:
$$\text{Paid CAC} = \frac{$120,000}{800} = $150$$
The blended figure made customer acquisition appear 33 percent cheaper ($100 versus $150). This distortion occurred because 400 organic buyers entered the store without direct ad intervention.
The Incremental Cost
Finally, the business runs a regional holdout test. The test proves that 40 percent of the platform-attributed paid buyers would have bought products without an ad. These users intended to buy through organic search or direct site visits.
Only 60 percent of the 800 paid customers represent true incremental volume created by ad spending:
$$\text{Incremental Customers} = 800 \times 0.60 = 480$$
Now, calculate the true cost to acquire an incremental customer:
$$\text{Incremental CAC} = \frac{$120,000}{480} = $250$$
When the executive team evaluates customer lifetime value (LTV CAC ratios), they must know the true unit cost. They must determine whether the true cost is $100 or $250.
Assume the average 12-month customer lifetime gross contribution is $200. An apparent blended CAC of $100 implies a healthy business. In reality, an incremental CAC of $250 means the marketing department loses $50 on every incremental customer it buys. The brand burns cash while blended dashboards report positive numbers.
Common Distortions
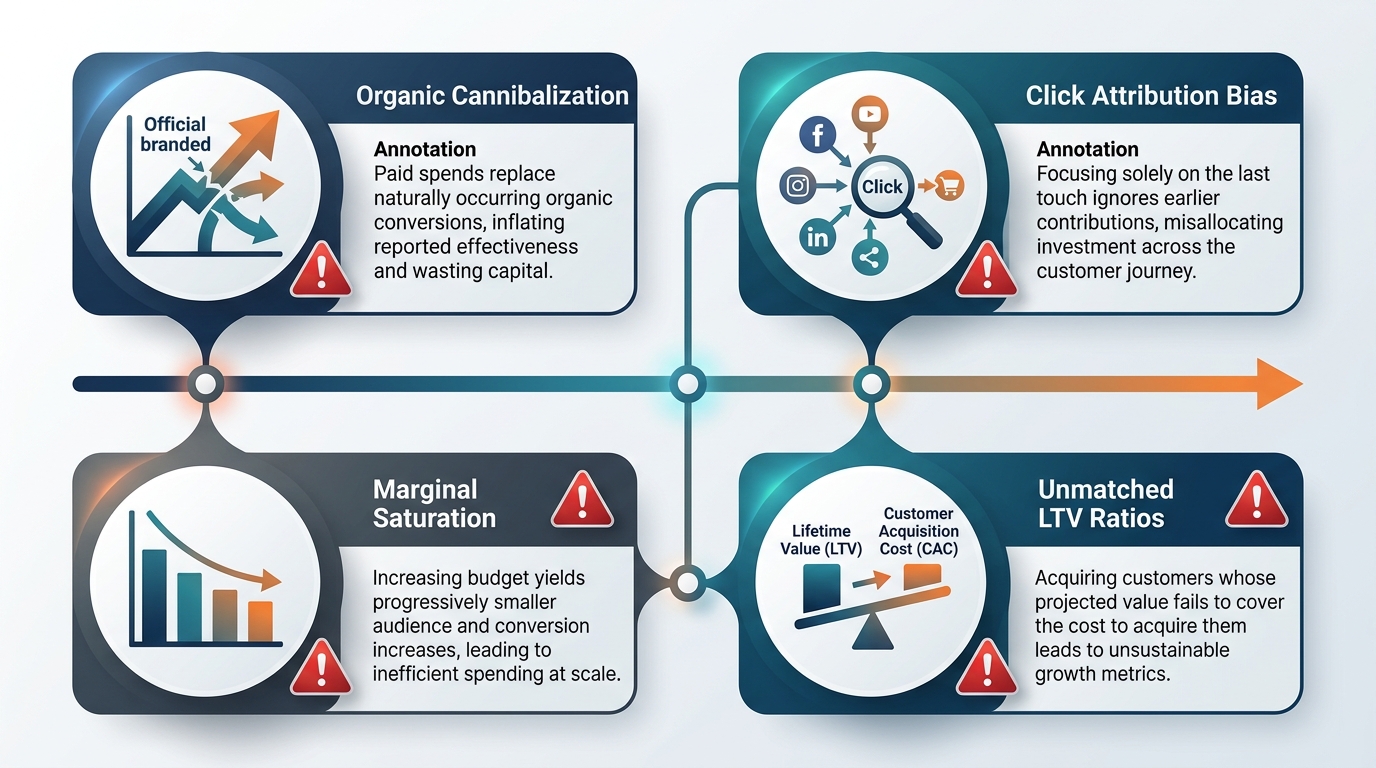
Blended acquisition numbers mislead growth teams in four common operating scenarios.
1. Organic Demand Cannibalization
When a company invests heavily in brand awareness, public relations, or retail distribution, baseline organic search demand rises. Ad managers often scale branded search and retargeting campaigns at the same time. These retargeting campaigns intercept high-intent customers who already planned to buy.
As noted by growth agency Eightx in their unit economics research, counting high-intent, brand-driven purchasers inside variable acquisition metrics distorts channel health. Blended CAC stays stable because organic volume supports the total. However, the ad budget produces diminishing returns.
2. Attribution Models Hide Latent Intent
Ad platforms usually use last-click or algorithmic data-driven attribution models. Attribution assigns conversion credit to specific marketing touchpoints across a user journey. These models look backward at touchpoints across short conversion windows.
If an existing buyer or high-intent shopper views a display ad minutes before buying, the platform claims conversion credit. The platform reports an artificially low acquisition cost.
Attribution measures only correlation between ad exposures and orders. It does not measure causal conversion lift. You need marketing mix modeling or holdout experiments to distinguish causal sales from mere ad interactions.
3. Scaling Past the Saturation Point
Blended CAC is an average metric, but media scaling operates on marginal economics. Marginal return measures the additional revenue that each extra dollar of ad spend generates. As you increase spending in an ad channel, you exhaust your core target audience. You reach marginal prospects who convert at lower rates.
Your marginal CAC rises quickly. Because blended CAC smooths costs across all past customers, the blended average climbs slowly. By the time leadership spots a rising blended CAC, the marketing team has overspent on saturated ad channels for months.
4. Flawed LTV to CAC Comparisons
Finance executives frequently check the standard rule of thumb: an LTV to CAC ratio of 3 to 1 or higher. This comparison fails when the underlying terms do not match.
As explained in Daymark's blended unit economics guide, using total orders instead of first-time buyers in the denominator inflates the ratio. This mistake leads brands to approve budgets that drain working capital.
If you compare a three-year gross margin LTV against a light, media-only blended CAC, you overstate your margins. To make the ratio meaningful, you must compare net present value lifetime gross profit against fully loaded customer acquisition costs.
Decision Framework
To manage ad budgets effectively, use different measurement tools for different strategic tasks. Do not rely on one metric for operational management and financial governance.
       Financial Planning               Daily Optimization           Capital Allocation
      ┌────────────────────┐          ┌────────────────────┐       ┌────────────────────┐
      │  Fully Loaded CAC  │          │      Paid CAC      │       │  Incremental CAC   │
      └─────────┬──────────┘          └─────────┬──────────┘       └─────────┬──────────┘
                │                               │                            │
                ▼                               ▼                            ▼
      Ensures long-term solvency       Tunes bids & ad creative      Governs cross-channel scale
When to Use Blended CAC
Use fully loaded blended CAC for quarterly board meetings, financial runway modeling, and executive balance sheets. Blended CAC answers an essential enterprise question: Does the business acquire customers efficiently across all commercial operations?
Track this number over time alongside total revenue to verify your macro business health. For practical implementation steps, read our guide on marketing ROI analysis.
When to Use Paid CAC
Use Paid CAC for daily tactical optimizations inside ad accounts. Paid CAC helps you compare relative ad set performance, creative asset variations, and campaign audience settings.
When your team optimizes bids, Paid CAC highlights immediate efficiency shifts. However, do not use click-based Paid CAC to set total channel budgets.
When to Use Incremental CAC and MMM
Use Incremental CAC and Marketing Mix Modeling (MMM) to set high-level media budgets across channels. Marketing mix modeling uses statistical analysis on aggregate historical sales and marketing data to quantify campaign impact.
- Econometric Models (MMM): Marketing mix modeling evaluates top-line store sales against historical spending patterns across all channels at once. It estimates baseline demand without user-level web tracking. This technique isolates the sales lift that each channel generates.
- Controlled Lift Experiments: Geo-lift tests and audience holdout groups validate your models. They confirm the causal cost to secure an extra buyer.
When MMM shows that a channel reaches diminishing marginal returns, reduce that ad budget. Reallocate the capital to channels with lower incremental costs. Do this reallocation even if ad platform dashboards show higher click-based return on ad spend (ROAS).
Blended metrics provide a top-line overview of business health, but they hide the real cost of scaling paid media. To protect profit margins, build measurement systems that separate returning traffic. Isolate organic baseline demand and verify true sales lift.
We help marketing and finance teams reconcile channel reporting with portfolio economics. Contact our measurement team at MediaMixModel.com to audit your acquisition unit costs and deploy econometric measurement models.
Stay in the loop
Get updates on new posts and resources.