Paid Media KPIs Must Explain More Than Cost
Choose paid media KPIs across delivery, engagement, conversion, unit economics, incrementality, and portfolio performance.

Paid media KPIs must explain business profit, not just ad platform delivery. Many marketing teams report platform metrics that look positive while total company profits decrease. A campaign can produce low click costs and high platform return on ad spend (ROAS) without new sales. ROAS measures gross revenue from an ad platform divided by ad spend.
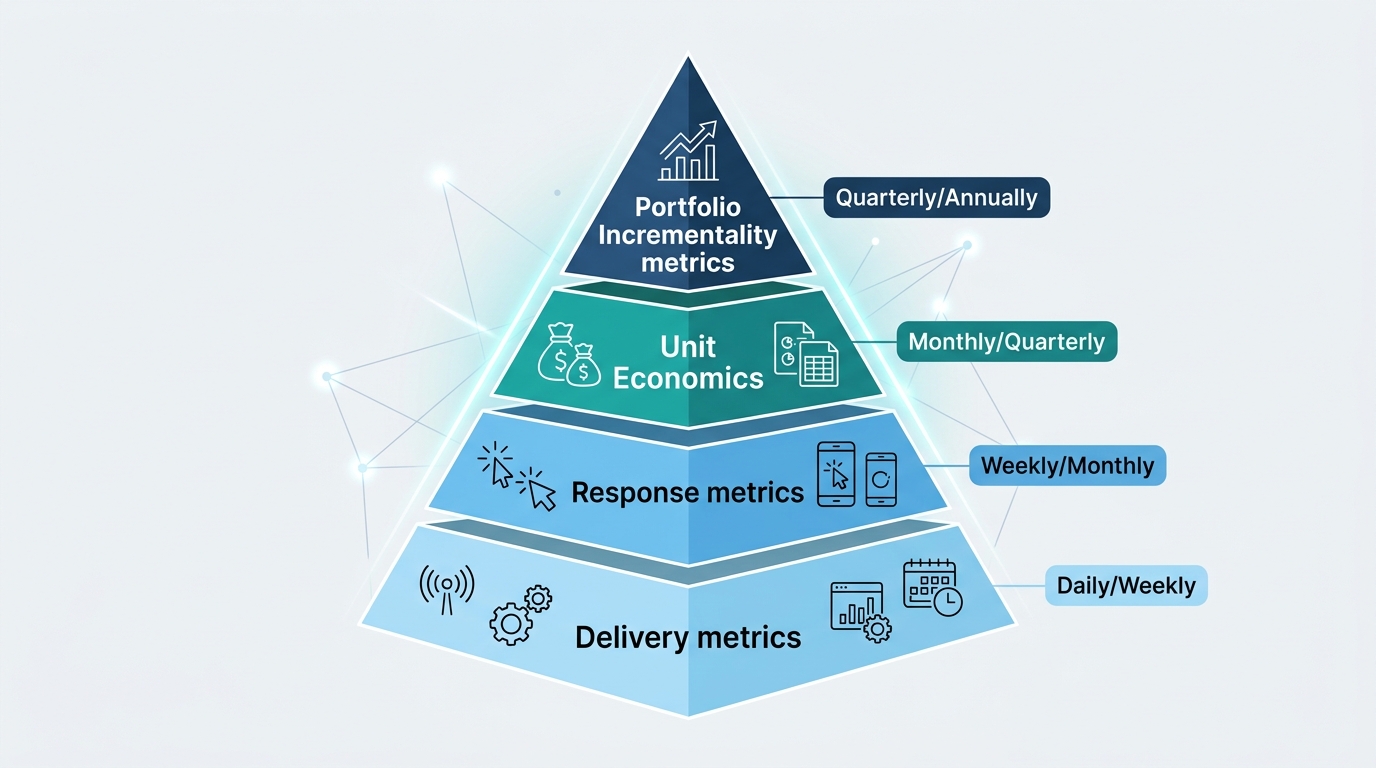
Performance marketing teams must organize paid advertising metrics into a clear hierarchy. This structure separates diagnostic numbers that monitor campaign execution from investment metrics that direct capital allocation.
KPI Hierarchy
A metric hierarchy classifies digital media metrics by their business role. Lower levels of the hierarchy monitor auction efficiency and user engagement. Upper levels evaluate net cash flow and enterprise value.
Teams confuse tactical delivery signals with strategic performance when they fail to separate these layers. For example, platform attribution models often count purchases that users would make anyway. In their analysis of marketing metrics, Ekimetrics showed that tactical performance metrics must systematically roll up into strategic KPIs. These strategic KPIs include customer lifetime value and marketing ROI.
The metric hierarchy contains four distinct levels:
- Delivery Metrics: Cost per thousand impressions (CPM), click-through rate (CTR), and cost per click (CPC). These technical metrics confirm ad delivery and audience reach.
- Response Metrics: Conversion rate (CVR) and cost per acquisition (CPA). These metrics measure direct user actions inside platform windows.
- Unit Economics: Customer acquisition cost (CAC), average order value (AOV), and contribution margin after ads. These figures tie media spend to company accounting.
- Incrementality and Portfolio Metrics: Incremental revenue, incremental ROAS (iROAS), and Marketing Efficiency Ratio (MER). These metrics prove causal lift and show macro portfolio returns.
| Level | Primary Metrics | Decision Type | Evaluation Window |
|---|---|---|---|
| 1. Delivery | CPM, CPC, CTR | Creative and bidding adjustments | Daily |
| 2. Response | Platform CPA, CVR, ROAS | Audience and channel pacing | Weekly |
| 3. Unit Economics | Blended CAC, LTV:CAC, Contribution Margin | Budget adjustments per segment | Monthly |
| 4. Portfolio Lift | Incremental ROAS, MER, Marginal Return | Enterprise capital allocation | Quarterly |
Different measurement tools support different levels of this hierarchy. Multi-touch attribution tracks fast operational data for Level 1 and Level 2. Attribution assigns credit to different ads along a customer journey. Randomized controlled experiments verify causal lift at Level 3 and Level 4. Marketing mix modeling (MMM) evaluates overall portfolio returns and non-digital drivers across historical cycles.
MMM uses statistical models to measure the sales impact of various marketing inputs. For a comprehensive overview of financial modeling methods, review our marketing ROI analysis guide.
Delivery Metrics
Delivery metrics measure how media platforms serve your ads in auctions. These performance marketing KPIs do not demonstrate business value. Instead, they operate as diagnostic checks for creative fatigue, audience saturation, and inventory costs.
Cost per thousand impressions measures market supply and auction competition. Calculate CPM with this formula:
$$\text{CPM} = \left(\frac{\text{Total Spend}}{\text{Total Impressions}}\right) \times 1{,}000$$
A sudden increase in CPM can indicate an audience saturation problem. It can also mean that platform competition increased for that audience segment.
Click-through rate measures how well an ad creative engages an audience. Calculate CTR with this formula:
$$\text{CTR} = \left(\frac{\text{Total Clicks}}{\text{Total Impressions}}\right) \times 100$$
Cost per click shows the price of each incoming visit. Calculate CPC with this formula:
$$\text{CPC} = \frac{\text{Total Spend}}{\text{Total Clicks}}$$
Media buyers often treat a low CPC as a sign of success. However, traffic quality matters more than traffic volume. Low CPCs often bring unqualified users who exit a website immediately.
A paid media reporting system must use delivery metrics only to diagnose technical delivery failures. Our paid media reporting template details this approach. As highlighted in the AdSights Paid Media Metrics Handbook, daily operational monitoring requires tracking CPM and CPC anomalies to protect spend pacing. You must not use them to confirm profitability.
Response Metrics
Response metrics measure the direct actions that visitors take after they see or click an ad. These actions include lead submissions, trial registrations, and immediate online checkout purchases.
Conversion rate measures the percentage of sessions that generate a target event:
$$\text{CVR} = \left(\frac{\text{Total Conversions}}{\text{Total Clicks}}\right) \times 100$$
Cost per acquisition shows the media spend required to create one conversion within an ad platform:
$$\text{Platform CPA} = \frac{\text{Campaign Media Spend}}{\text{Attributed Conversions}}$$
Return on ad spend calculates the gross revenue attributed by a platform divided by ad spend:
$$\text{Platform ROAS} = \frac{\text{Platform Attributed Revenue}}{\text{Campaign Media Spend}}$$
Platform-reported response metrics create a common operational risk. Ad platforms rely on pixel tracking and attribution windows. These platforms frequently assign credit to ads when a customer planned to purchase anyway.
As the agency QRY explains in their full-funnel KPI guide, platform ROAS overstates true business contribution on branded search and retargeting campaigns. It overstates contribution by factors of two or three because it counts existing demand.
Teams must treat platform CPA and ROAS as diagnostic indicators. They reveal whether an algorithm finds the target profile. They do not demonstrate whether the campaign generated incremental cash flow.
Unit Economics
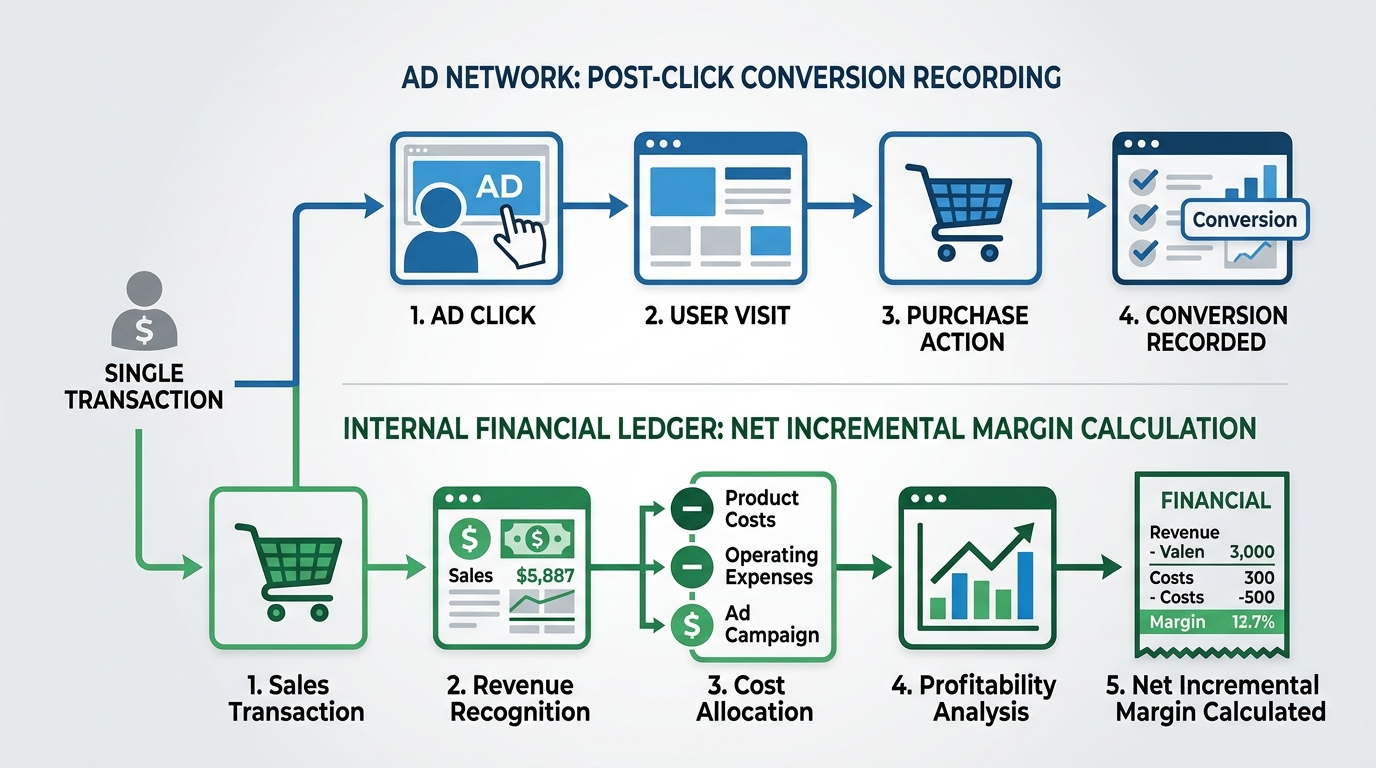
Unit economics connect paid advertising metrics to your general ledger. Ad platforms often claim success on transactions that lose money after product fulfillment, customer service, and operating overhead. Finance teams require metrics that include all direct production and fulfillment costs.
Average order value establishes the baseline transaction size:
$$\text{AOV} = \frac{\text{Total Revenue}}{\text{Total Orders}}$$
Customer acquisition cost expands the CPA formula to include all acquisition expenses. CAC includes media spend, platform fees, agency retainers, and the cost of creative development. Calculate blended CAC with this formula:
$$\text{Blended CAC} = \frac{\text{Total Acquisition Spend}}{\text{Total New Customers Acquired}}$$
Contribution margin after ads proves whether a paid media campaign creates cash profit. This metric subtracts cost of goods sold, variable fulfillment costs, processing fees, and media spend from gross revenue:
$$\text{Contribution Margin After Ads} = \text{Revenue} - \text{COGS} - \text{Variable Costs} - \text{Total Ad Spend}$$
Consider this hypothetical e-commerce example with 1,000 orders:
- Gross Revenue: $100,000
- Cost of Goods Sold (40%): $40,000
- Shipping and Payment Fees: $10,000
- Ad Spend: $35,000
- Platform Attributed ROAS: 2.85 ($100,000 / $35,000)
$$\text{Contribution Margin After Ads} = $100{,}000 - $40{,}000 - $10{,}000 - $35{,}000 = $15{,}000$$
The campaign generated a 2.85 ROAS on the platform dashboard. However, the business retained only $15,000 in net cash from $100,000 in sales.
If ad spend increases to $52,000 to chase more conversions, the business loses money despite a positive ROAS. Practitioners at Attrock emphasize that ROAS misleads teams because it ignores product delivery expenses, merchant fees, and variable overhead. Unit economic metrics guard your organization against this error.
Incrementality and Portfolio Metrics
Upper-funnel and portfolio-level decisions require causality. Incrementality metrics measure outcomes that ad exposure alone creates. Incrementality isolates ad impact from baseline demand, organic traffic, and existing brand equity.
Incremental revenue represents the real revenue created by marketing interventions:
$$\text{Incremental Revenue} = \text{Observed Revenue in Exposed Group} - \text{Baseline Revenue in Holdout Group}$$
In their breakdown of marketing mix modeling metrics, Mass Analytics notes that incremental revenue must serve as the foundation for measuring true channel efficiency.
When you divide this incremental revenue by channel spend, you produce incremental ROAS:
$$\text{iROAS} = \frac{\text{Incremental Revenue}}{\text{Channel Spend}}$$
Marketing Efficiency Ratio measures blended portfolio performance across all marketing channels without double-counting attributed sales:
$$\text{MER} = \frac{\text{Total Business Revenue}}{\text{Total Marketing Spend}}$$
Marketing teams need multiple measurement methods to capture these portfolio numbers accurately. Attribution models measure short-term interactions for quick campaign changes. Controlled tests isolate pure causality for specific channels.
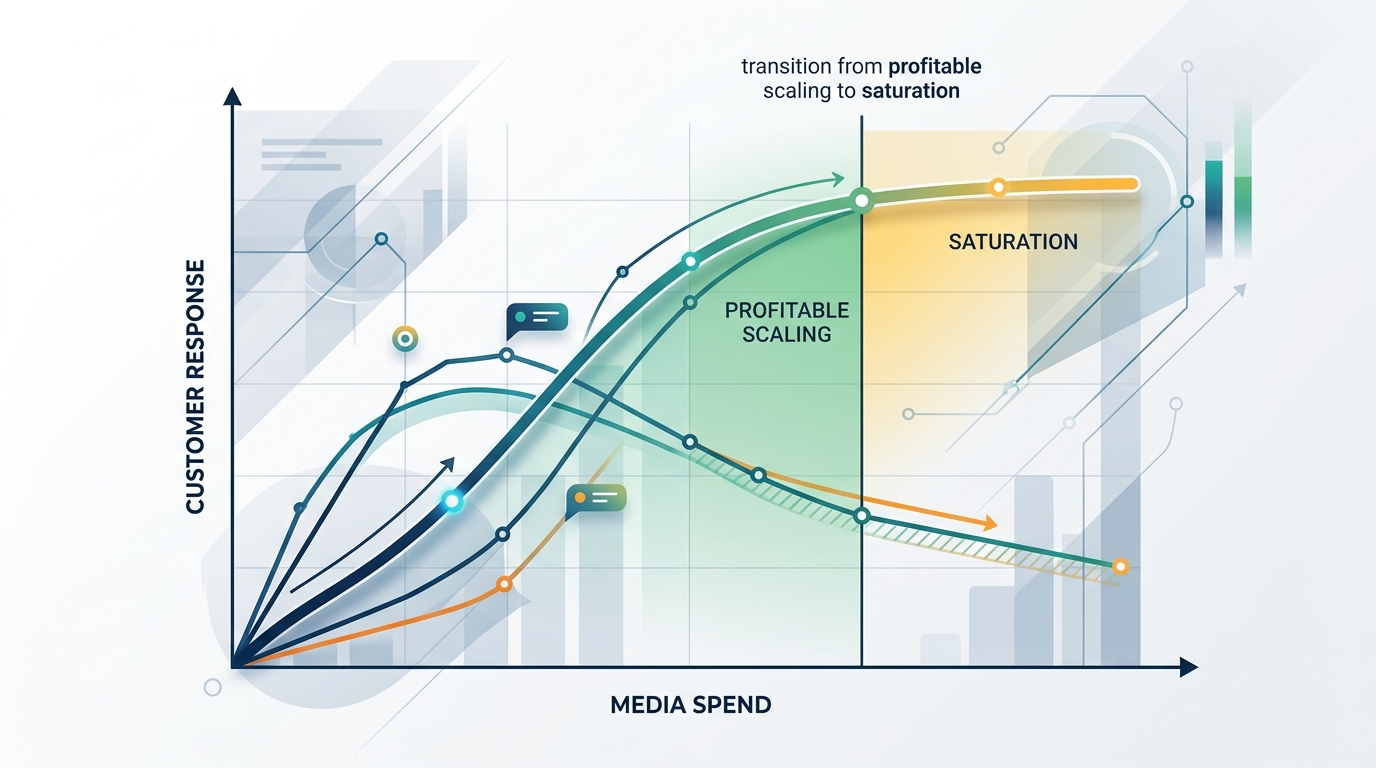
Learn how to set up clean control groups in our incrementality testing guide. Marginal return measures the additional revenue gained from each extra dollar of spend.
Marketing mix modeling sits above platform tracking. MMM applies econometric regression to aggregate historical data. It quantifies the sales contribution of each channel, accounts for marketing saturation, and captures baseline brand momentum. While digital attribution models credit branded search with high returns, MMM often identifies branded search as an expense that harvests existing organic demand.
Metric Governance
A metric governance framework establishes rules for reporting and acting on digital media metrics. Without clear governance, different teams optimize for conflicting outcomes. Performance marketing teams pursue high platform conversions. At the same time, finance teams observe falling operational margins.
First, assign specific cadences to each metric tier:
- Daily Cadence: Monitor delivery metrics. Watch CPM, CPC, and impression pacing to detect ad delivery anomalies.
- Weekly Cadence: Review response metrics and platform CPAs. Reallocate tactical budgets between creative assets.
- Monthly Cadence: Audit blended CAC and contribution margin after ads. Reallocate funds across distinct channel campaigns.
- Quarterly Cadence: Rebalance macro budgets using MMM outputs, incrementality test results, and marginal returns.
Second, separate steering metrics from diagnostic metrics. A steering metric determines budget increases or decreases. A diagnostic metric explains why a change occurred.
Never use CPM, CPC, or platform-reported ROAS to steer quarterly marketing capital. Use iROAS, contribution margin after ads, and MER as your steering metrics.
Third, recalibrate models when tools show conflicting answers. If an ad platform reports a 4.0 ROAS, but a regional holdout experiment shows a 1.5 iROAS, adjust the platform weight downward.
As demonstrated by Aragil's media audit research, marketing teams must use experimental holdouts to calibrate their MMM and attribution models. They must not accept uncalibrated platform reports. This alignment protects budgets from inflated claims.
Summary
Paid media KPIs deliver value only when teams read them at the correct organizational level. Delivery metrics monitor technical auction costs. Response metrics evaluate creative engagement inside ad accounts. Unit economics confirm transaction profitability after operating expenses. Incrementality metrics and MMM models verify causal business expansion. Align your marketing reporting with these core business outcomes to build a durable, profitable media investment strategy.
Stay in the loop
Get updates on new posts and resources.