A Paid Media Reporting Template Must Support a Budget Decision
Build a paid media report with executive KPIs, pacing, channel diagnostics, attribution context, experiments, and next-budget actions.
A paid media reporting template must do one job well. It must give the reader enough evidence to make a budget decision. Most templates fail this test. They list platform metrics in the order the ad platform exports them. This article gives you a structure built around decisions, not data dumps.
Executive summary
The executive summary comes first. It must fit on one page. State the period, total spend, and the result against target. Name the one decision the report supports. Do not list every metric here. Save detail for later sections.
A good executive summary answers three questions in plain language: how much we spent, what we received, and what we should do next. A stakeholder who reads only this page must know whether the account needs attention. This order matches guidance from agencies that build client reports. They put spend against budget first, results against target second, and next steps last, according to paceads.com.
Keep the summary short. Three findings and one recommended action are enough. This approach treats the summary as a working document, not a record, per getfairview.com.
Budget and pacing
Budget pacing shows whether spend is on track against the plan. This section comes early because a client who is off pace needs to know before anything else. Show one row per platform or account: monthly budget, spend to date, and the variance as a percent.
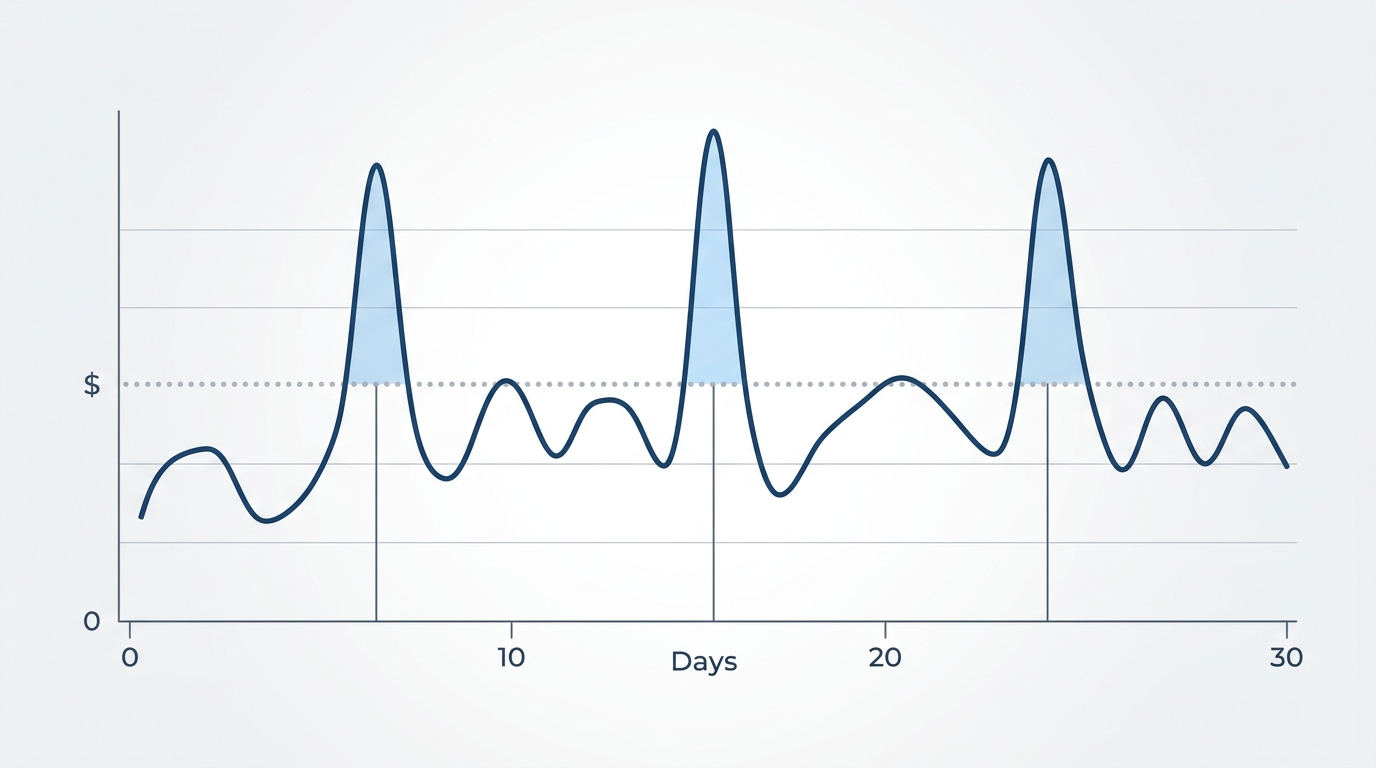
Flag any variance over five percent with one sentence of explanation. State the cause and the action, if any, you took. A daily spend trend chart helps readers see pacing problems and spend spikes. This practice appears in template guidance for Google and Meta reporting at metricnexus.ai.
Add a projected spend line for the rest of the period. This tells the client what to expect if current pacing continues. Include a short note on whether the current split between platforms still makes sense.
Business outcomes
Business outcomes connect spend to what the business cares about, such as revenue, pipeline, or qualified leads. Executives read this section most closely. Use four to six metrics, not more. Spend, conversions, and cost per acquisition or return on ad spend against target form the core figures.
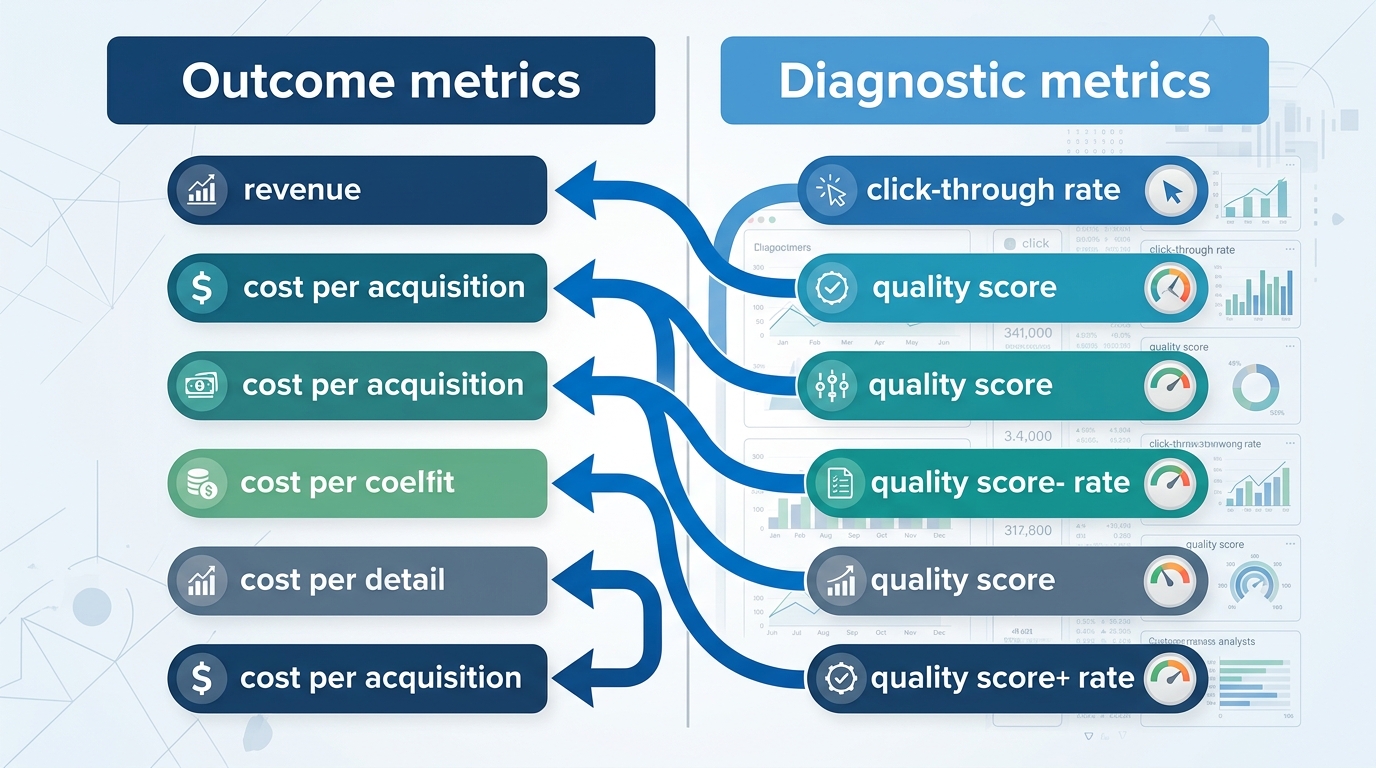
Add one diagnostic metric only if it explains a change in the outcome numbers. A metric with no target and no clear consequence for the business does not belong here. This distinction separates decision metrics from diagnostic metrics, per reporting guidance from metricswatch.com.
If you run more than one platform, blend the outcome view into one table. Do not report Google, Meta, and LinkedIn as three separate blocks on this page. Executives want one view of total performance, then detail by channel. For more on connecting these numbers to overall marketing return, see our guide on marketing ROI analysis.
Worked example (hypothetical)
Assume a client spends $50,000 in a month across two platforms.
| Metric | Target | Actual | Variance |
|---|---|---|---|
| Spend | $50,000 | $49,200 | -1.6% |
| Conversions | 400 | 380 | -5.0% |
| Cost per acquisition | $125 | $129 | +3.2% |
| Return on ad spend | 4.0x | 3.8x | -5.0% |
This table is a hypothetical example only. In a real report, explain each variance row in one sentence. Link the number to a cause, such as a bid change or a seasonal dip.
Channel diagnostics
Channel diagnostics explain why the outcome numbers moved. This section holds click-through rate, cost per click, conversion rate, and impression share. These metrics answer "why," not "should we scale, cut, or hold."
Split diagnostics by platform. The causes of a change on Google Search differ from the causes on Meta. A framework for this uses three tiers: money, channel, and diagnostic. The author at mixedmetrics.com places diagnostics as the layer that explains movement in the channel tier above it.
Do not let diagnostics crowd out outcomes. A report that shows click-through rate beside revenue gives them equal visual weight. That tells the reader that a symptom and an outcome carry the same importance. They do not. Keep diagnostics smaller, later, and clearly labeled as explanatory, not decision-driving.
For search campaigns, list keyword-level detail only for the campaigns that matter most. For social campaigns, add audience and creative notes only where they explain a real shift in results. This keeps the diagnostics section useful without turning it into a full export of every platform metric.
Measurement confidence
Every number in a paid media report comes from a measurement method, and every method has limits. A reporting template must state which method produced each number and how much the reader should trust it. Writers often omit this section. Its absence causes arguments in the next meeting.
Three methods answer different questions. Readers need to know which one they see.
- Attribution assigns credit to specific ads or clicks based on tracked user paths. It works at the campaign and ad level but struggles once tracking breaks down, such as under cookie loss or app tracking limits.
- Incrementality testing, such as geo holdouts or lift tests, measures the actual lift a campaign causes by comparing exposed and unexposed groups. It answers whether a channel caused a result, not just whether it was present.
- Marketing mix modeling (MMM) is a statistical method that uses aggregate spend and sales data over time to estimate each channel's contribution. It does not require user-level tracking. This makes it resilient to cookie loss and consent limits, according to observix.ai.
No single method gives the full picture. MMM estimates should come with confidence intervals. Channels with more spend usually produce more certain estimates than channels with little spend, a point made in guidance on operationalizing MMM from getrecast.com. Attribution and MMM sometimes disagree. When they do, an incrementality test settles the question, because it tests cause directly, not just correlation with spend.
State the method next to each number in your report. Label attribution-based conversions as "tracked," MMM-based contribution as "modeled," and lift-test results as "tested." This one habit prevents most disputes about whether a channel worked. For a deeper look at combining these methods into one view, see our page on unified marketing measurement.
Actions and tests
A report that ends with numbers and no decisions is a record, not a tool for action. Close every report with a short table of decisions: the action, the owner, and the deadline. The team at getfairview.com recommends this structure for campaign reports.
List two or three planned actions for the next period, each with the result you expect. If you need client approval for a budget shift or new creative, name it here. A clear question at the end of the report gives the client a reason to reply, which keeps the relationship active. This point comes from agency reporting guidance at paceads.com.
Where a decision is uncertain, propose a test rather than a guess. A geo holdout or a budget shift test can settle a disagreement between attribution and MMM. This turns your reporting template into a tool that drives the next month of work, not just a summary of the last one. For the larger strategy behind these choices, see our guide on paid media strategy.
Conclusion
A paid media reporting template earns its place only if it supports a decision. Structure it around pacing, outcomes, diagnostics, measurement confidence, and named next actions, in that order. Skip the parts that only describe the past without shaping what comes next.
If you want a reporting structure built for decisions rather than data dumps, we offer a measurement-ready reporting framework. It applies attribution, incrementality, and MMM together, so your next report tells you what to do, not just what happened.

Stay in the loop
Get updates on new posts and resources.