ROAS vs MER: One Measures Ads, the Other Measures the Business
Compare ROAS and marketing efficiency ratio, understand their formulas and biases, and learn when each metric supports better decisions.
ROAS vs MER: One Measures Ads, the Other Measures the Business
ROAS and MER answer different questions.
ROAS measures how a platform, campaign, or channel performed.
MER measures whether your total marketing spend produces sufficient revenue for the whole business.
Neither number tells you what occurs without the ad spend.
You must pair both numbers with margin data and causal tests before you make budget decisions.
Definitions and Formulas
Return on ad spend (ROAS) divides revenue attributed to an ad by the cost of that ad.
The formula is simple: attributed revenue divided by ad spend.
The word "attributed" carries weight.
ROAS is always a claim about causation made by the entity that counts events (soku.ai).
On a platform dashboard, that entity is the platform that wants credit for the sale (soku.ai).
Marketing efficiency ratio (MER) divides total store revenue by total marketing spend across all channels.
MER requires no attribution model.
You take the revenue figure from your store database.
Then you divide it by every dollar spent on marketing, including agency fees and creative production (shopify.com).
Some teams express a related metric, blended ROAS, as the inverse of MER as a percentage.
A 25 percent MER equals a 4.0x blended ROAS.
The two numbers describe the same relationship from different directions (adsrunner.com).
| Metric | Formula | Scope | Attribution needed |
|---|---|---|---|
| ROAS | Attributed revenue ÷ ad spend | One channel or campaign | Yes, platform-defined |
| MER | Total revenue ÷ total marketing spend | Entire business | No |
| Blended ROAS | Total revenue ÷ total ad spend | Entire business | No |
What Each Metric Sees
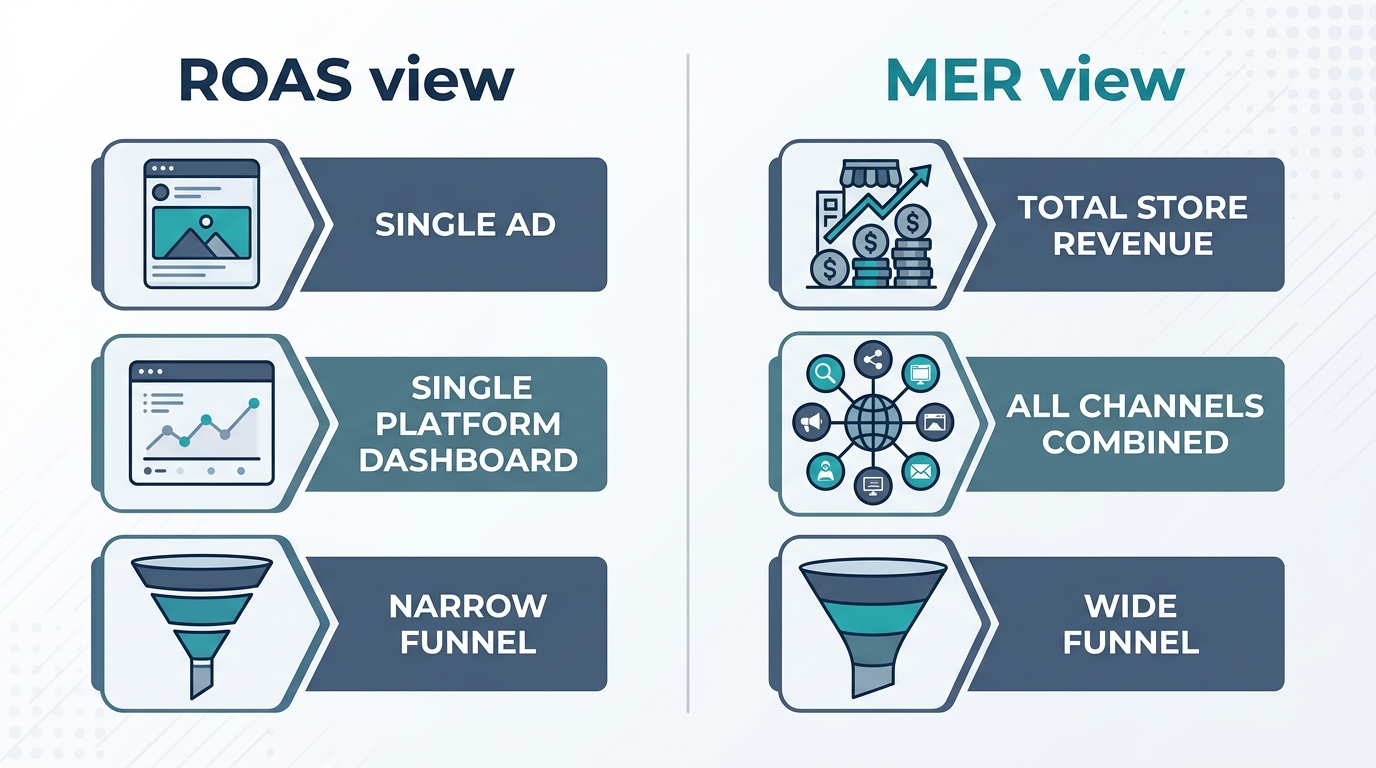
ROAS sees a narrow slice of activity.
It shows how one campaign or one platform performed against its own claimed contribution to sales.
Marketers use ROAS to adjust bids, swap creative assets, and shift budget within a channel (shopify.com).
MER sees the whole business.
It answers this question: does the business generate revenue efficiently from all marketing spend combined?
Review MER weekly and show it to a finance team.
MER does not depend on the counting method of any single platform (soku.ai).
Neither view is complete alone.
MER cannot explain why efficiency changed.
If MER falls from 5.2x to 3.8x, you know a problem occurred.
The ratio alone does not identify the cause:
- weak creative assets,
- a spend spike on one channel, or
- a drop in organic traffic (adlibrary.com).
Our marketing ROI analysis guide explains how to divide a falling ratio by channel and cohort.
Attribution Overlap
Attribution is the practice that assigns credit for a sale to a specific touchpoint, such as an ad click or ad view.
Each platform uses its own attribution window and model.
Meta defaults to a seven-day click and one-day view window.
Google Ads offers data-driven attribution.
TikTok defaults to a seven-day click window.
These windows overlap and often claim credit for the same sale (getfairview.com).
If you sum ROAS across three platforms, the total usually overstates real revenue.
A customer who saw a Meta ad, searched on Google, and bought goods can generate three separate attributed sales on dashboards.
MER avoids this problem because it divides one verified revenue figure by total spend.
MER uses no attribution step (getfairview.com).
Attribution is not the only evidence method available.
Incrementality testing measures the causal effect of spend.
It compares a group exposed to ads with a control group not exposed to ads.
The conversion rate gap between the groups is the incremental lift, also called incremental ROAS (adlibrary.com).
Our guide to incrementality testing explains how to design a holdout test that isolates true causal lift.
Marketing mix modeling (MMM) is a third method.
MMM uses historical spend and revenue data across channels to estimate the marginal contribution of each channel.
Marginal contribution is the additional revenue that each additional unit of spend generates.
For example, MMM projects that an extra ten thousand euros of weekly Google spend will produce a defined amount of incremental revenue (adlibrary.com).
Profitability Context
Revenue ratios mislead if you ignore profit margin.
A one-hundred-dollar sale at twenty percent margin is not the same as a one-hundred-dollar sale at sixty percent margin.
Standard MER treats them as identical.
If your product mix shifts toward lower-margin items, MER can rise while actual profit falls (soku.ai).
To correct this problem, calculate a margin-based version of the ratio.
Divide contribution margin, not revenue, by marketing spend.
Contribution margin is revenue minus variable costs.
This number gives the result that finance teams care about: profit rather than top-line sales (soku.ai).
Worked example (hypothetical).
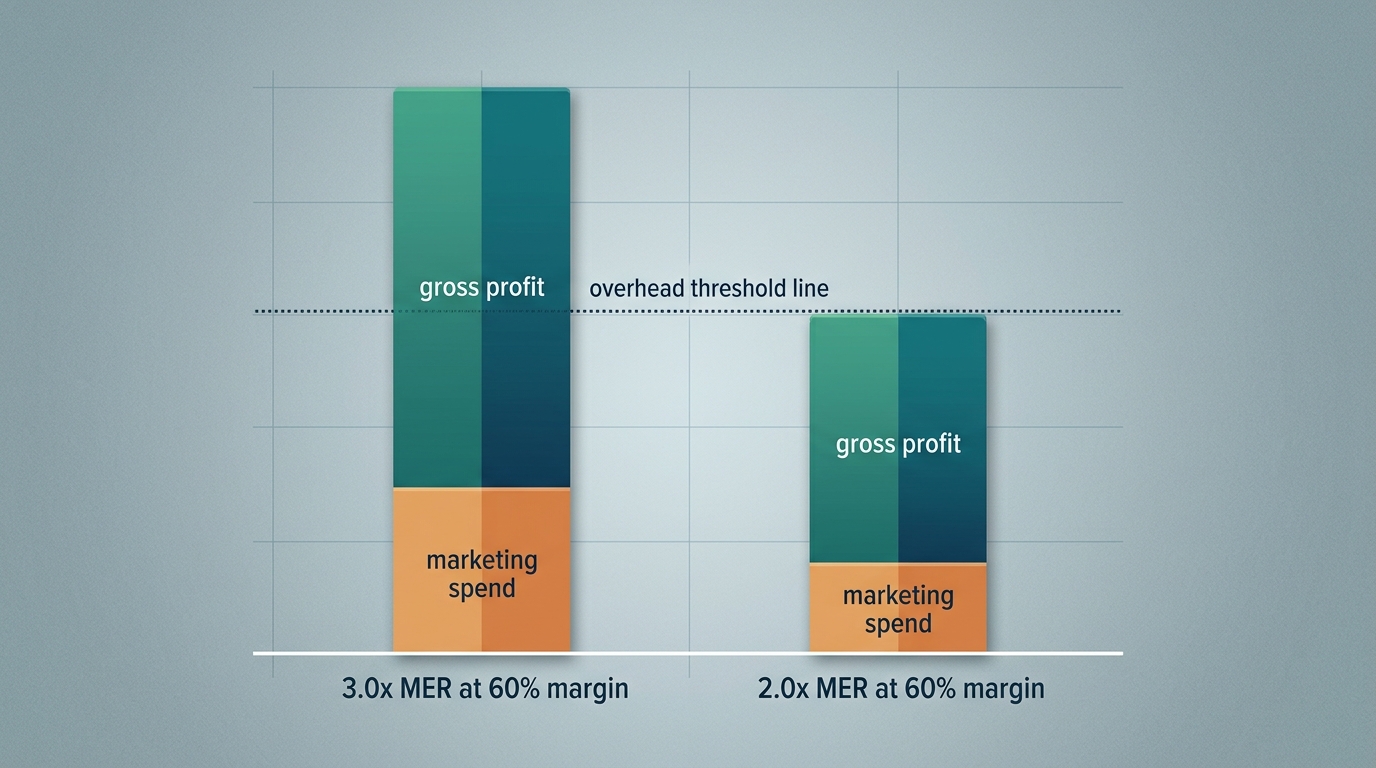
Assume a brand has a sixty percent gross margin and a 3.0x MER.
For every dollar spent on marketing, the brand generates three dollars in revenue.
This revenue produces one dollar and eighty cents in gross profit before overhead costs (getfairview.com).
Now assume the MER of the same brand falls to 2.0x.
Gross profit per marketing dollar drops to one dollar and twenty cents, which may not cover fixed costs (getfairview.com).
You cannot make this comparison with channel ROAS.
The platform-claimed revenue in the numerator does not match the revenue that drives real gross profit.
For more information about how margin interacts with marginal spend, read our page on marginal ROAS.
That guide explains the point where added spend stops returning sufficient incremental value to justify itself.
Decision Examples
Consider a hypothetical brand that runs Meta, Google, and TikTok ads.
Each platform reports strong ROAS.
The sum across all three platforms suggests a healthy 6.0x blended return.
However, total store revenue divided by total spend shows an MER of only 3.2x.
The gap indicates attribution overlap, where multiple platforms claim credit for the same purchase.
Trust MER for the total budget decision.
Platform ROAS still helps, but only inside each platform.
Use ROAS to decide which ad set or creative receives more budget within a fixed total.
Do not use platform ROAS to decide the overall spend level.
Do not use MER to pick a winning ad, because MER cannot separate channels (soku.ai).
Consider a second hypothetical case.
A brand maintains stable Meta spend, but MER falls over three weeks.
A media mix model built earlier in the year projected that Meta contributes forty-five percent of revenue.
If MER falls while spend remains stable, the model may have drifted.
The team must recalibrate the model rather than assume that the channel stopped working (adlibrary.com).
Better Measurement Stack
No single ratio answers every question.
A defensible measurement stack combines four tools.
Each tool answers a different question at a different cadence:
- MER, reviewed weekly. Compare it to a target from your contribution margin. This metric authorizes a budget increase or decrease (soku.ai).
- Platform ROAS, reviewed weekly within each channel. Use it only to allocate budget inside that platform. Never sum it across platforms (soku.ai).
- Incrementality tests, run quarterly on your largest channel. Use a holdout test to measure how much of the platform credit is real (soku.ai).
- Marketing mix modeling, rebuilt or reviewed annually. Use it to optimize channel mix based on marginal contribution estimates (adlibrary.com).
Attribution, incrementality testing, and marketing mix modeling are not interchangeable.
Attribution assigns credit based on observed touchpoints and carries platform bias.
Incrementality testing isolates a true causal effect through a controlled experiment.
Marketing mix modeling estimates the marginal contribution of each channel from historical patterns across the full budget.
Treat them as three separate evidence methods, not as three ways to ask the same question.
Conclusion
ROAS and MER are both descriptive ratios.
Neither ratio proves what caused a sale.
ROAS shows how a platform performed by its own accounting.
MER shows whether your total marketing program is efficient based on your actual revenue and spend figures.
Pair both with contribution margin, and review them at the correct cadence.
Confirm platform claims with incrementality tests and marketing mix modeling before you commit budget to platform conclusions.
MediaMixModel.com offers a measurement assessment to help you separate correlation from causal evidence in your marketing data.

Stay in the loop
Get updates on new posts and resources.