Your Break-Even ROAS May Be Too Low
Calculate break-even ROAS from contribution margin, understand common formula mistakes, and add LTV and incrementality to scaling decisions.
Break-even return on ad spend (ROAS) is the lowest revenue ratio that pays back your variable costs. Return on ad spend measures revenue divided by ad spend. The formula is simple. Divide 1 by your contribution margin, expressed as a decimal. If your contribution margin is 40 percent, your break-even ROAS is 2.5x. Below that number, each ad dollar loses money on the sale itself.
Many brands set their break-even ROAS too low. They use gross margin instead of contribution margin. Gross margin ignores payment fees, shipping, returns, and other variable costs. This error can move your true break-even from 1.4x to 2x. That difference decides which campaigns you keep or stop, as Improtics explains.
Core Formula
The break-even ROAS formula is direct:
Break-even ROAS = 1 ÷ Contribution Margin
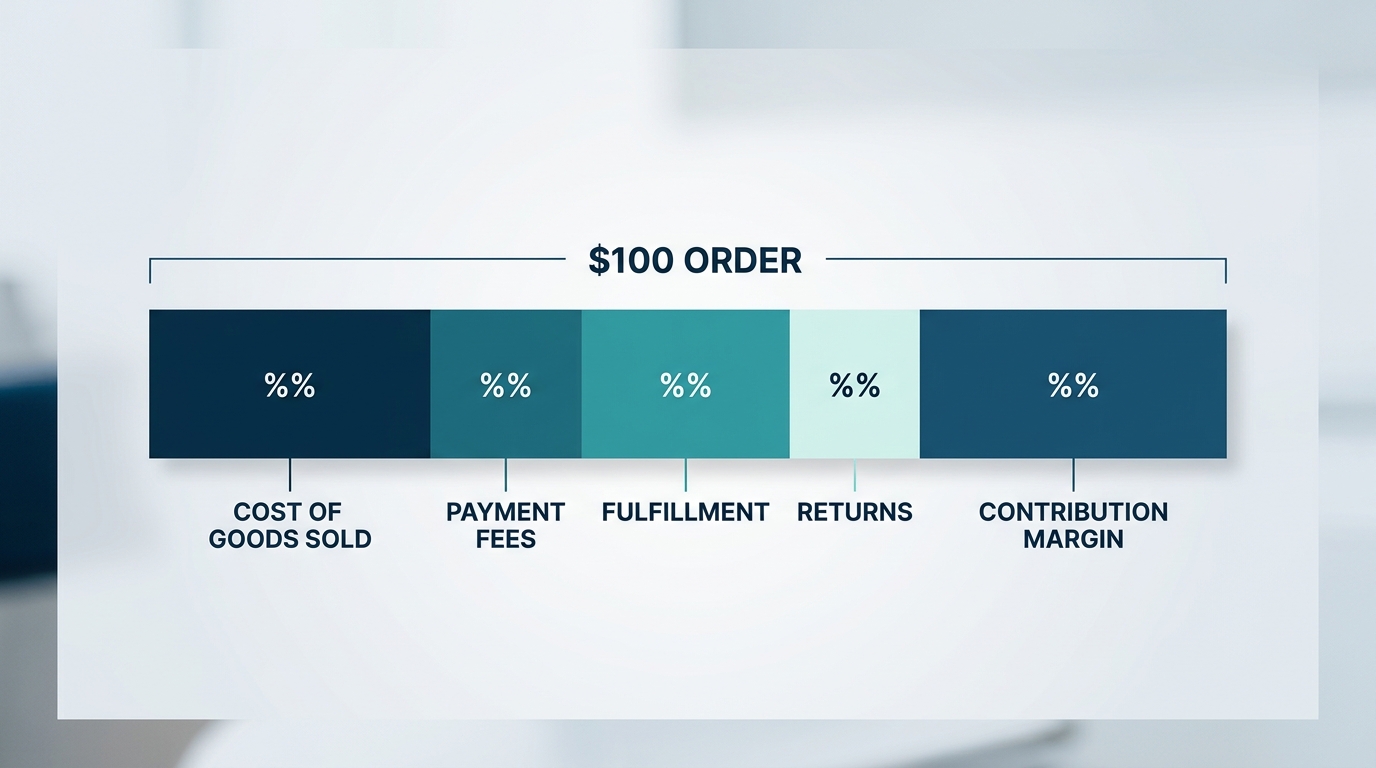
Contribution margin is revenue minus every cost that changes with each order. This includes cost of goods sold, payment processing fees, fulfillment, and returns. It does not include fixed costs like rent, salaries, or software subscriptions, as Calclet's calculator guide notes.
This formula answers one question. It tells you the minimum ROAS a campaign needs to cover its direct costs. It does not tell you if the campaign meets your profit goal. It does not account for cash timing, inventory purchases, or overhead.
Some practitioners call this number the first-order break-even. It measures profit on the first sale alone. It does not include repeat purchases or lifetime value, as John Parvu describes in his analysis of break-even math.
Contribution Margin Inputs
To calculate contribution margin correctly, list every cost that increases with revenue. A typical direct-to-consumer brand includes these line items:
| Cost Category | Example Rate |
|---|---|
| Cost of goods sold | 30-40% of revenue |
| Payment processing | 2-3% of revenue |
| Fulfillment and shipping | 5-10% of revenue |
| Returns and refunds | 3-8% of revenue |
Subtract each of these rates from 100 percent to find your contribution margin. Do not stop at gross margin. Gross margin usually subtracts only the cost of goods sold. Eightx warns that using gross margin instead of contribution margin sets a break-even target that is too easy to hit. A campaign that clears a gross-margin break-even can still lose money once you count real variable costs.
This distinction matters most at scale. A ten-point gap between gross margin and contribution margin can shift break-even ROAS by a full point or more. This shift reflects typical direct-to-consumer cost structures, as Taylor Sicard notes in his review of break-even ROAS and MER.
Worked Examples
These two examples are hypothetical. They show how contribution margin changes the break-even threshold.
Example A: High-margin subscription brand
- Gross margin: 62 percent
- Extra variable costs (fulfillment, fees, returns): 8 percent
- Contribution margin: 54 percent
- Break-even ROAS: 1 ÷ 0.54 = 1.85x
Example B: Lower-margin apparel brand
- Gross margin: 40 percent
- Extra variable costs: 15 percent
- Contribution margin: 25 percent
- Break-even ROAS: 1 ÷ 0.25 = 4.0x
The gap between these two numbers is large. A brand with a 25 percent contribution margin needs more than double the ROAS of a brand with a 54 percent margin. It needs that higher return just to break even, as Michael Dishmon's analysis of MER and gross margin floors shows. If your team applies one flat ROAS target across products with different margins, you will misjudge many campaigns.
You can also express contribution margin ROAS (cmROAS) directly. Multiply revenue by contribution margin percent. Then divide that result by ad spend. MHI Growth Engine's guide to ROAS calculation uses this formula:
cmROAS = (Revenue × Contribution Margin %) ÷ Ad Spend
A $20,000 campaign with a 57 percent contribution margin and $5,000 in ad spend yields a cmROAS of 2.28x. This result shows that the campaign generated real profit, not just revenue. Compare this value to your break-even threshold to judge performance. For more information on spend efficiency, see our guide on ROAS versus MER.
Returns and Repeat Purchase
Returns reduce your real revenue. If you calculate ROAS on gross sales, you overstate performance. Use net revenue, after you subtract returns and refunds, to find your true ROAS, as MHI Growth Engine recommends.
Repeat purchases change the calculation. Some brands accept a first-order cmROAS below 1.0x if customer lifetime value covers the difference over time. Customer lifetime value is the total net profit that a customer brings during their relationship with your business. This strategy works only under two conditions:
- You have a measured repeat purchase rate from your own order history.
- You have enough cash to fund the gap until customers buy again.
QodeBites explains this requirement in its review of break-even assumptions. Do not assume repeat purchases without data. A subscription brand with high retention can justify a lower first-order threshold. A brand with unknown repeat purchase rates cannot do this. Track both numbers separately: your first-order break-even and your lifetime-value-adjusted break-even.

Attribution and Incrementality
Reported ROAS and true ROAS are not the same number. Attribution systems assign credit to ad platforms, but some of that credit is false. Attribution identifies which ads a buyer saw before a purchase. A customer who buys anyway still counts as an attributed sale.
Incrementality testing measures the difference. Incrementality is the percentage of sales that ads actually caused. One method is a geographic holdout test. You show ads in most markets and withhold them from a matched set of markets. The sales difference between both groups shows true ad lift, as described in Ad Library's practitioner framework for measuring ad ROI.
A second method uses marketing mix modeling, or MMM. MMM uses statistical analysis of aggregate spend and sales data over time to estimate each channel's contribution. It does not require individual user tracking. This makes MMM useful when cookie and device tracking fail, as Ad Library's framework explains.
Attribution, incrementality testing, and MMM answer different questions:
- Attribution shows which touchpoint received credit for a sale.
- Incrementality testing shows how much of that sale the ad campaign actually caused.
- MMM shows how each channel contributes to overall revenue over time.
No single method provides complete truth. Each method fills a gap that the other methods leave.
A stated 4.0x reported ROAS can hide a much lower true ROAS. Holdout tests can reveal that only 60 percent of attributed revenue was incremental. True ROAS then drops to 2.8x, as MDS's guide to break-even ROAS demonstrates with a worked example. Compare this adjusted number to your contribution margin break-even, not to the raw platform report.
For a deeper review of full measurement plans, read our marketing ROI analysis guide.
Scaling Guardrails
Break-even ROAS is a floor, not a target. Scaling spend at your break-even point leaves no funds for errors, fixed costs, or profit. Set your working target above break-even. Include a buffer that matches your risk tolerance and your cash reserves.
Use allowable customer acquisition cost (allowable CAC) as a parallel check. Allowable CAC is the maximum money you can spend to acquire one customer without a loss. This metric expresses the limit in dollars rather than as a ratio. Disagreement between allowable CAC and break-even ROAS points to bad margin inputs, as Taylor Sicard notes in his comparison of these metrics.
Scale spend below first-order break-even only when you have real evidence. This evidence can come from cohort payback data, subscription retention rates, or incrementality testing. Without that evidence, spending below break-even creates cash loss, not growth, as Calclet's guide warns.
Track marginal return as you scale, not just average ROAS. Marginal return is the return you earn on your next dollar of spend. A campaign can look profitable in total while it loses money on its last increment of spend. Review your core paid media metrics regularly alongside contribution margin. You can use our guide to paid media KPIs.
Conclusion
Break-even ROAS gives you a clear floor for campaign decisions. However, you must calculate it from contribution margin, not gross margin. Revenue divided by ad spend shows no profit data unless you know your real costs. Combine that number with incrementality evidence and repeat-purchase data before you scale.
Connect your paid media measurement to your real unit economics. Contact MediaMixModel.com to learn how attribution, incrementality testing, and marketing mix modeling work together to show your true return on ad spend.

Stay in the loop
Get updates on new posts and resources.