Cross-Channel Attribution Cannot Track Every Effect
Learn how cross-channel attribution connects journeys, deduplicates conversions, and where identity, privacy, and walled gardens limit accuracy.

Cross-channel attribution assigns conversion value to marketing touchpoints across multiple digital channels. It shows recorded customer journeys across search engines, social media, display networks, and email campaigns.
Multi-channel attribution cannot measure every marketing effect. It only tracks recorded clicks and web visits. It does not measure ad views without clicks, offline sales, or baseline consumer demand. For this reason, marketing teams must treat cross-channel attribution as an observational tool, not causal proof.
To build a reliable measurement system, marketing teams must distinguish observed journeys from true causal contributions.
The Cross-Channel Problem
Modern consumer behavior divides across multiple devices and touchpoints. A consumer can discover a brand through a smartphone ad, research the product on a laptop, and purchase on a desktop computer. This cross-device path breaks identity chains.
Platform self-reporting increases this challenge. When multiple ad platforms claim credit for one purchase, reported conversions exceed actual revenue. A platform reports credit because it only sees its own impressions and clicks. As technical guidance from dataxgrowth.com shows, this error occurs because the model distributes credit across captured touchpoints. It does not demonstrate what caused the sale.
Attribution tracks correlation, not causation. A consumer who plans to buy a product often clicks a branded search ad or a retargeting display ad. The attribution software awards credit to that final ad touchpoint. Yet the purchase would occur without that ad.
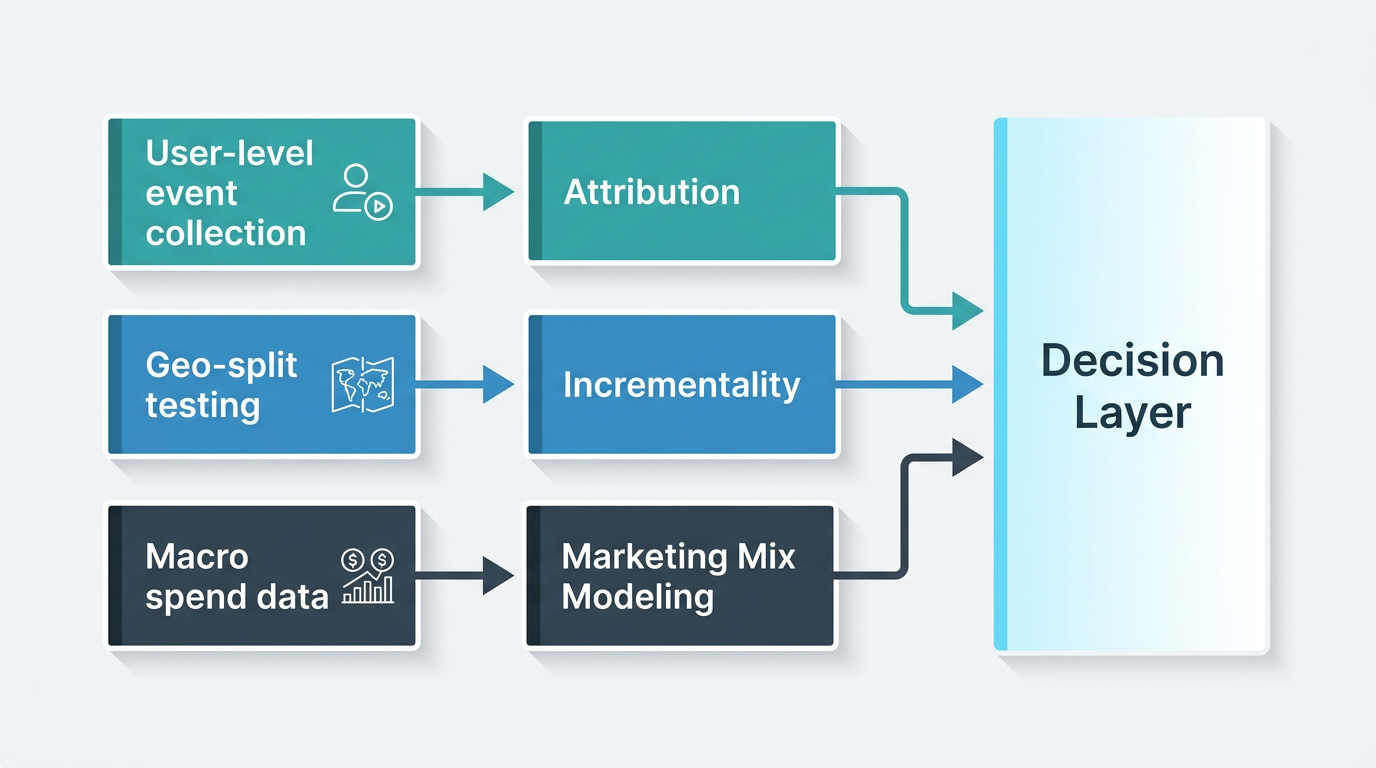
To measure marketing accurately, teams must understand the distinct operational boundaries between three measurement disciplines:
| Measurement Approach | Data Requirements | Primary Question Answered | Blind Spots |
|---|---|---|---|
| Cross-Channel Attribution | User-level identifiers, event timestamps, UTM tags, click IDs | Which touchpoints appeared on recorded conversion journeys? | Ad impressions, untracked devices, offline conversions |
| Incrementality Experiments | Holdout groups, geographic split groups, spend variations | Did this specific channel cause an increase in sales? | Difficult to run continuously across all campaigns simultaneously |
| Marketing Mix Modeling (MMM) | Aggregate weekly or daily spend, revenue, external controls | How do all channels contribute to baseline and incremental revenue? | Granular intra-day and creative-level mechanics |
Identity and Event Architecture
A solid identity and event architecture forms the base of any cross-channel marketing attribution engine. Upstream data collection errors cause incorrect downstream attribution models.
First, engineering teams must establish consistent data collection schemas. Every touchpoint requires standardized campaign parameters, consistent click identifiers, session timestamps, and canonical event names. Teams must configure server-side tracking pipelines, such as Google Tag Manager server containers and vendor conversion APIs. Server-side tracking protects conversion data from network failures and browser script blocking.
Second, teams must implement identity resolution. Identity resolution connects distinct anonymous web sessions to a unified customer profile. As detailed in the identity resolution architecture from dashbroad.com, organizations must rely on a deterministic hierarchy rather than probabilistic guesses.
Teams must organize their identity hierarchy in this priority order:
- Authenticated Internal ID: The unique user account identifier stored in your production database.
- Hashed PII: SHA-256 hashed email addresses and phone numbers collected through checkout or lead capture forms.
- First-Party Cookie IDs: Persistent identifiers written directly from your root domain server headers.
- Session Identifiers: Ephemeral parameters that track a single sequence of pageviews.
Deterministic matching binds historical sessions together only when a user logs in or submits verified form data. Organizations must avoid unverified device fingerprinting. Fingerprinting creates unstable graphs, violates consumer privacy standards, and causes regulatory penalties. To review how identity structures influence your reporting, explore our guide to cookieless marketing measurement.
Attribution Methods
Once events enter the data pipeline, marketing organizations assign financial credit to touchpoints using rule-based or algorithmic models. Teams can review detailed mechanics in our guide to marketing attribution models.
Rule-Based Models
Rule-based models distribute conversion value based on static, predefined positions in the customer path:
- First-Touch: Assigns 100% of the conversion value to the first recorded touchpoint. This approach inflates the value of top-of-funnel discovery channels.
- Last-Touch: Assigns 100% of the conversion value to the final touchpoint before conversion. This model overvalues bottom-of-funnel branded search and direct navigation.
- Linear: Divides credit equally among all recorded interactions on the path. This method ignores the relative importance of individual touchpoints.
- Time-Decay: Gives progressive weight to touchpoints that occur closer in time to the conversion event.
- Position-Based (U-Shaped): Assigns 40% of the value to the first touch, 40% to the last touch, and splits the remaining 20% across middle interactions.
Data-Driven and Algorithmic Models
Data-driven models remove static rules. They use mathematical equations to assign touchpoint weight based on historical path data.
Shapley value models derive from cooperative game theory. A Shapley model treats each marketing channel as a player in a game. It calculates the marginal contribution of a channel by comparing conversion rates across user paths that contain the channel against paths that omit it.
The principles for algorithmic credit distribution, documented in the model breakdown by zamartz.com, show how path permutations isolate incremental lift.
Consider a three-touch journey scenario:
$$\phi_i(v) = \sum_{S \subseteq N \setminus {i}} \frac{|S|!(|N| - |S| - 1)!}{|N|!} (v(S \cup {i}) - v(S))$$
In this equation, $N$ represents the set of all channels. $S$ represents a coalition of channels without channel $i$. The term $v(S)$ represents the conversion value of that coalition.
Markov chain models offer another algorithmic solution. A Markov model represents customer journeys as directed graph networks. Each channel serves as a node, and the model calculates the transition probability from one node to the next.
Analysts then calculate the removal effect for each channel. The model removes a channel from the graph and recalculates the overall journey success probability. Channels whose removal causes large drops in completion receive proportional credit.
Algorithmic models evaluate the paths that marketing systems record. However, they remain bounded by observational data. If a channel drives sales through word-of-mouth or ad impressions without clicks, these models cannot capture that effect.
Deduplication
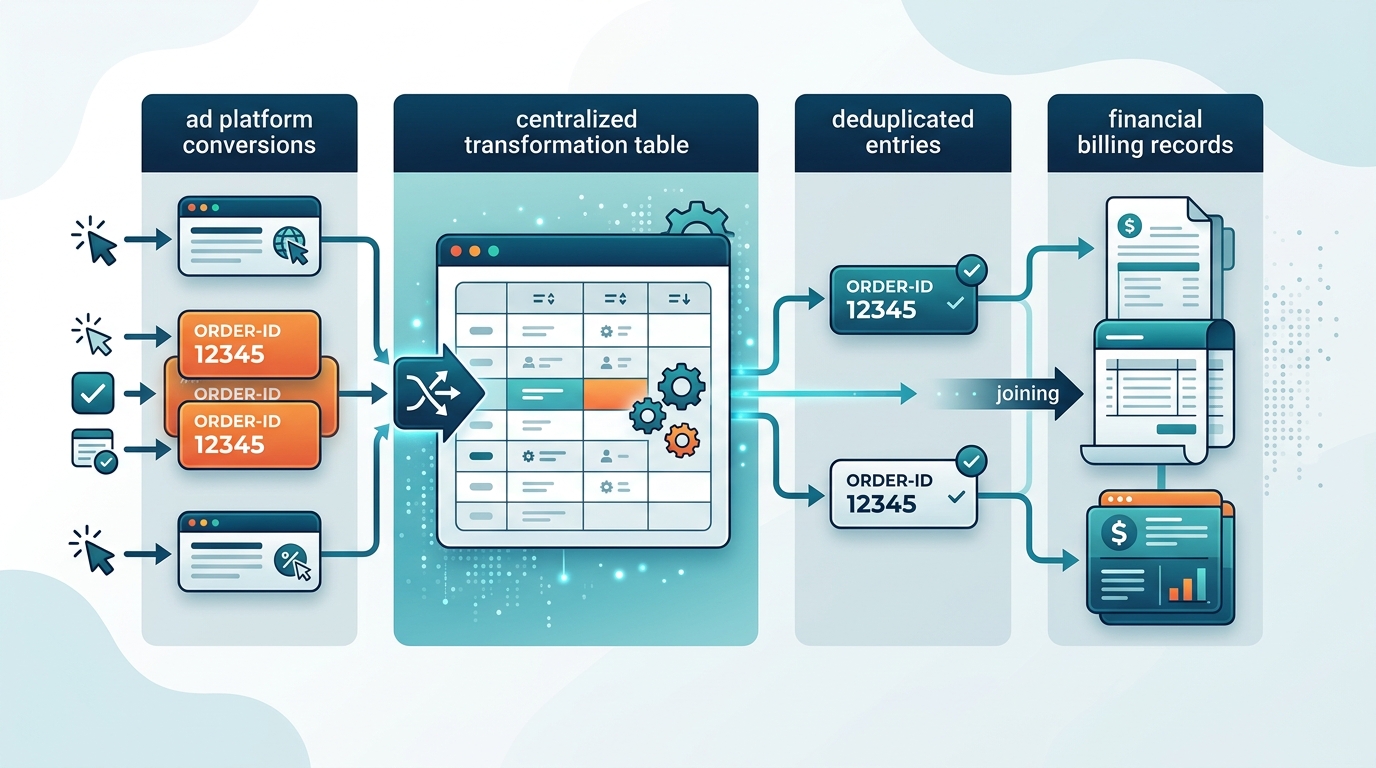
When organizations connect multiple ad channels, total reported conversions often exceed the numbers in their bank accounts. Ad platform dashboards claim credit independently. A user who clicks a paid search ad, an organic search listing, and a social retargeting ad registers as a full conversion inside each platform.
To solve this problem, data engineering teams must implement a central conversion deduplication pipeline. Deduplication reconciles multiple touchpoints into a unified transaction log before data reaches financial ledgers.
Central data warehouses must assign a single deterministic transaction identifier to each checkout or lead submission. The pipeline compares the internal transaction ID, the user identity record, and the platform click timestamps.
       [ Consumer Conversion Event ]
                     |
       ( Generates Unique Order ID )
                     |
        +------------+------------+
        |                         |
  [ Meta CAPI ]            [ Google Ads ]
(Reports Order ID)       (Reports Order ID)
        |                         |
        +------------+------------+
                     |
        [ Data Warehouse Pipeline ]
    ( Deduplicates against Master Record )
                     |
  [ Single Attributed Financial Log Entry ]
When systems evaluate conversions, the pipeline applies a unified lookback window across every channel. If a team allows a 30-day click window for one channel and a 7-day click window for another, reporting favors the wider window. Technical implementation recipes from martechcookbook.com recommend tracking your deterministic share alongside your modeled share. This approach ensures your reporting clearly separates verified data from statistical approximations.
The following worked example illustrates this deduplication logic. A customer completes a $200 purchase after interacting with three separate marketing channels.
Internal Transaction ID: TX-90218
Transaction Revenue: $200.00
Recorded Touchpoint History:
- Day 1: Paid Social Ad Click (Campaign: Prospecting_Video)
- Day 4: Paid Search Ad Click (Campaign: Generic_Category)
- Day 6: Email Campaign Ad Click (Campaign: Abandoned_Cart)
- Day 6: Transaction Completed
Platform-reported outcome:
- Meta claims: $200.00
- Google Ads claims: $200.00
- Email Platform claims: $200.00
- Total Platform Claim: $600.00 (300% of actual revenue)
Central deduplicated outcome:
- Total Actual Revenue: $200.00
- Position-Based Rule Allocation (40/20/40):
- Paid Social: $80.00
- Paid Search: $40.00
- Email: $80.00
- Total Attributed Revenue: $200.00
Central deduplication prevents duplicate counts. It provides an honest accounting of how touchpoints align across recorded customer journeys.
Privacy and Walled Gardens
User-level tracking faces severe technical constraints. Modern privacy architectures block third-party user tracking across domains and applications.
Apple App Tracking Transparency requires explicit consumer consent to track users across third-party apps. Web browser privacy controls, such as Safari Intelligent Tracking Prevention, restrict client-side cookie storage and purge tracking query parameters.
Privacy regulations penalize unauthorized cross-site tracking. Examples include the General Data Protection Regulation in the European Union and the California Consumer Privacy Act. When consumers decline consent, client-side attribution platforms lose access to the user journey.
Walled gardens present an equal challenge for omnichannel attribution. Major ad platforms function inside closed data environments. Meta, Google, Amazon, and TikTok collect detailed engagement data within their owned systems.
These platforms do not share granular, user-level impression and browsing histories with external databases. They share performance metrics only through aggregated data clean rooms or masked conversion reporting endpoints.
Consequently, offline and online attribution breaks down. A consumer can view a connected television ad on YouTube, see a billboard, and buy a product in a retail store. That journey leaves no continuous digital trail.
Click-based attribution cannot link these interactions. Marketing teams that rely solely on click tracking allocate too much budget to low-funnel digital capture channels. They underfund high-impact brand initiatives.
Triangulation
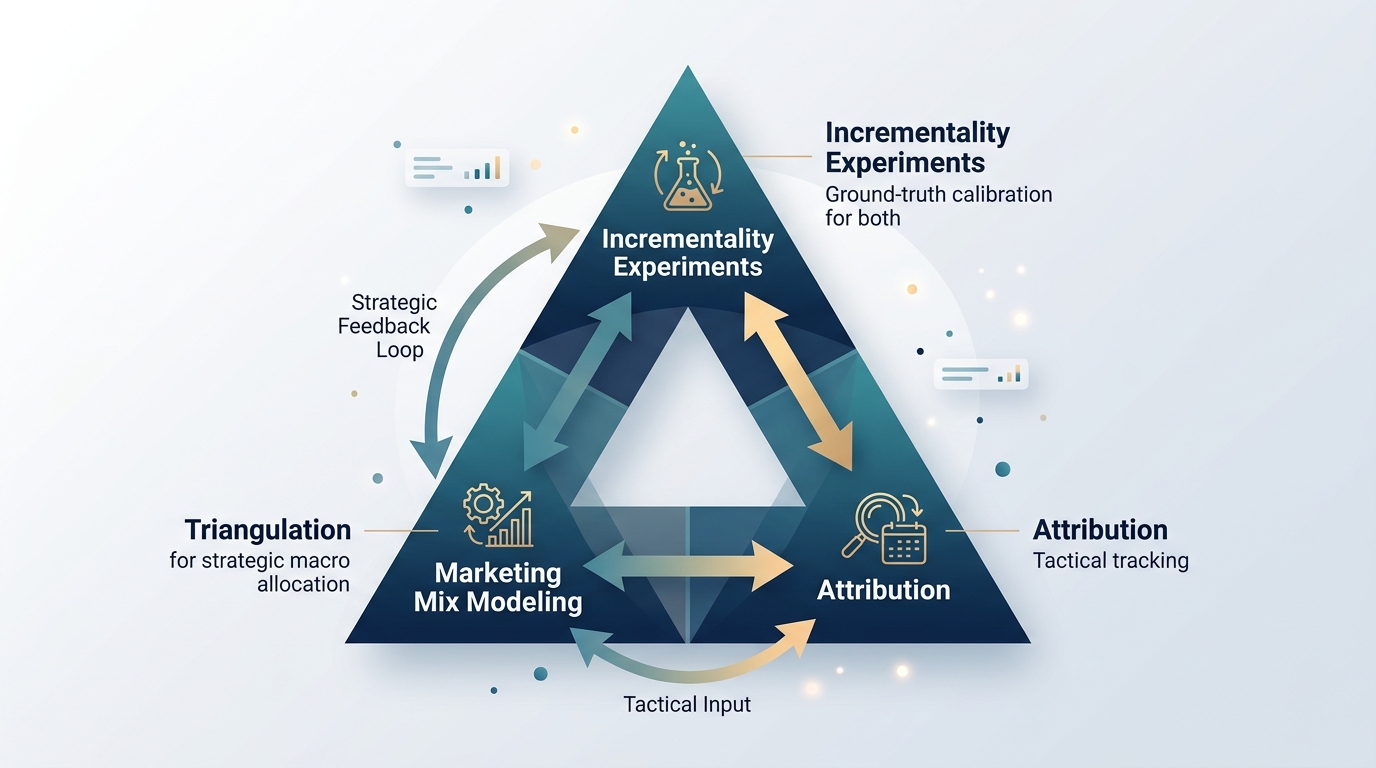
To solve the blind spots of user attribution, mature organizations use marketing triangulation. Triangulation combines three distinct measurement methodologies into a unified operating framework.
Each methodology answers a specific strategic question, as outlined in the practical measurement architecture from soku.ai. No single system serves as an absolute source of truth.
The three core components include:
- Granular Attribution: Server-side event tracking captures bottom-up click paths and daily campaign trends. Attribution provides operational monitoring for creative assets, audience targets, and keywords.
- Incrementality Experiments: Lift studies, matched-market tests, and randomized geo-holdout experiments provide causal validation. Testing reveals whether a channel produces net-new conversions or simply claims existing demand.
- Marketing Mix Modeling (MMM): Econometric regression models analyze top-down aggregate data across historical sales, media spend, pricing changes, promotional discounts, and external macroeconomic trends. MMM requires no user-level cookies or platform tracking tags.
                   [ Ground Truth ]
              Incrementality Experiments
             /                          \
(Calibrates Priors)               (Calibrates Weights)
           /                              \
          v                                v
Marketing Mix Modeling <------------> Granular Attribution
    [ Macro Allocation ]                 [ Tactical Ops ]
Incrementality experiments serve as the bridge that aligns top-down and bottom-up models. Controlled geo-lift experiments reveal true marginal returns. Marginal returns measure the additional revenue gained from each extra dollar spent. These returns help analysts calibrate Bayesian statistical assumptions inside their marketing mix models.
Similarly, incrementality coefficients adjust attribution rules. They discount channels that claim credit without generating real sales lift. Modern cookieless attribution guides from datascale.de show that combining server-side data, MMM, and experimental holdouts provides the most reliable measurement stack.
To learn how to connect these methods inside an enterprise stack, read our guide on unified marketing measurement.
Build a Resilient Measurement Engine
Cross-channel attribution cannot track every marketing effect. Relying on last-click or position-based attribution alone leads to misallocated budgets, inflated channel claims, and poor media efficiency. Media efficiency measures the return on ad spend, which compares generated revenue to advertising costs.
Marketing teams gain lasting advantage when they pair bottom-up click tracking with top-down econometric modeling and experimental holdouts.
If your team struggles with disconnected dashboards, disputed platform credit, or unmeasured media channels, you must upgrade your measurement architecture.
Request a Unified Measurement Architecture Assessment with our modeling team. We evaluate your data collection pipelines, calibrate your attribution systems, and establish defensible media mix models.
Stay in the loop
Get updates on new posts and resources.