When You Can Trust Data-Driven Attribution
Understand data-driven attribution, its inputs, model logic, reporting uses, privacy constraints, and the difference between credit and incrementality.

Trust data-driven attribution for tactical, in-platform credit assignment. Do not trust it as proof that a channel causes revenue. Data-driven attribution reports how credit gets split across touchpoints. A touchpoint is a point where a customer sees or interacts with an ad. The model bases this split on patterns in your data, without a controlled test. For proof of what a channel adds, use incrementality testing or marketing mix modeling (MMM).
What Data-Driven Attribution Is
Data-driven attribution (DDA) is a method that assigns credit for a conversion across many touchpoints. It uses statistical patterns instead of a fixed rule. Older models used simple rules instead. Last-click attribution gives all credit to the final touchpoint before a conversion. First-click attribution gives all credit to the first touchpoint. Position-based and time-decay models split credit by preset weights.
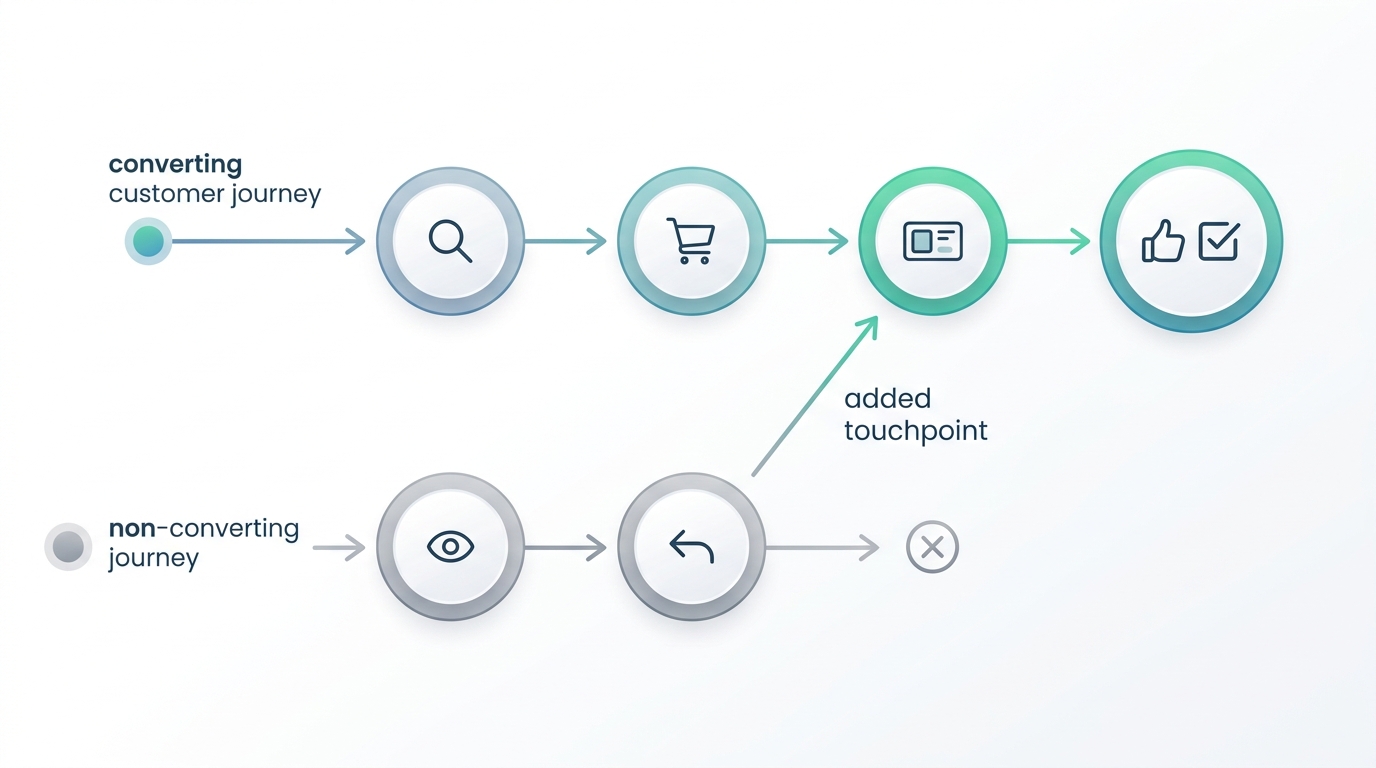
DDA looks at real paths. It examines paths that led to a conversion and paths that did not. It learns which touchpoints, in which order, tend to appear before a conversion happens. Google describes its version this way: the model evaluates converting and non-converting paths. Per Google Analytics Help, it learns "how different touchpoints impact key event outcomes," using signals such as device type and creative type.
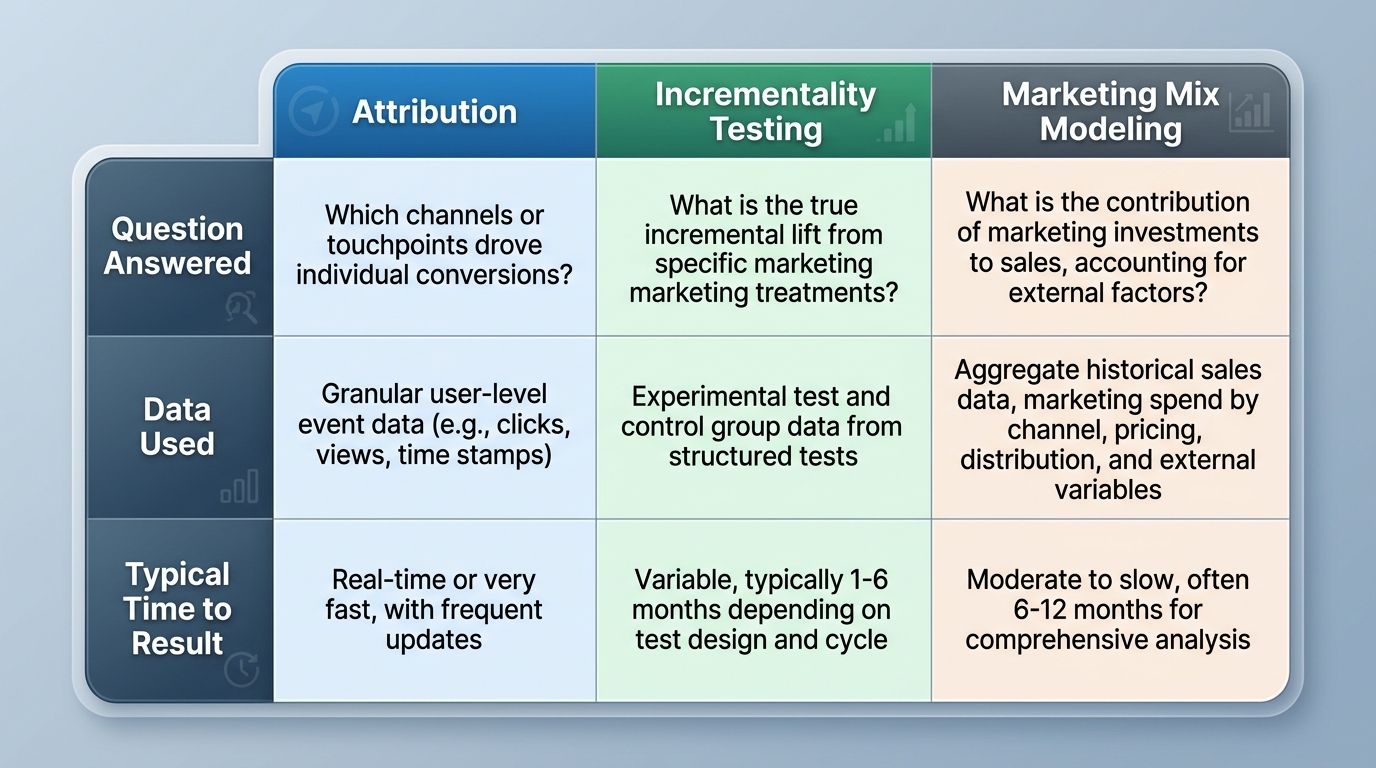
DDA is attribution, not incrementality testing. Attribution answers a reporting question: how did credit get split across observed touchpoints. Incrementality testing answers a causal question: would the conversion happen without this touchpoint. MMM answers a third question: how much revenue ties to each channel over time. These three methods often disagree. This disagreement gives useful information, not an error.
How Models Assign Credit
Most data-driven models use a counterfactual comparison at their core. A counterfactual comparison estimates what would happen under different conditions. Google states that its models "compute the counterfactual gains of Google ad exposures by training on data from randomized controlled trials." The models then compare users who saw an ad against a similar holdback group who did not, according to Google Analytics Help.
One common method behind these models is the Shapley value. This is a method from game theory that estimates each touchpoint's contribution. It does this by testing many possible combinations of touchpoints and orders. One attribution guide states that "Google Analytics 4 (GA4) utilises the Shapley Value approach in its Data-Driven Attribution (DDA) model." The model draws on path data "from the last 50 interactions within the 90-day lookback window," according to mauroromanella.com.
In plain terms, the model asks a question. If we add this touchpoint to a path, how much does the estimated chance of conversion change. Google Ads states that data-driven attribution "gives more credit to those valuable ad interactions on the customer's path." It does this by comparing converting and non-converting paths, according to Google Ads Help.
Hypothetical example. Suppose two paths lead to a purchase:
| Path | Touchpoints | Result |
|---|---|---|
| A | Search ad, then Display ad, then Direct visit | Purchase |
| B | Display ad, then Direct visit | No purchase |
The model notices that a search ad, when added to a path like B, leads to a purchase. It assigns more credit to the search ad step in Path A than to the other steps. It does this because the search ad changed the outcome. This is a simplified illustration, not an exact output from any real model.
Data Requirements
A data-driven model needs a large amount of data to find reliable patterns. Too few conversions give the model little to learn from. Google Ads states a minimum data volume for its own model. It recommends "at least 200 conversions and 2,000 ad interactions in supported networks within a 30-day period." The model "will still function with less data," but with weaker precision, according to Google Ads Help.
Below that level, model behavior can look almost identical to last-click attribution. The model has too few examples to tell touchpoint contributions apart. One guide to GA4 attribution warns that "with low conversion volumes you may see DDA conversion credits resemble last-click attribution," according to growthmethod.com.
Data quality matters as much as data volume. The same guide states that "the accuracy of DDA depends heavily on the quality of your first-party data collection." Gaps from cookie consent choices, ad blockers, or cross-device journeys reduce reliability, according to growthmethod.com. A model trained on broken or partial tracking data produces confident-looking numbers. These numbers do not reflect real customer behavior.
GA4 and Ad-Platform Behavior
Google Analytics and Google Ads both run data-driven attribution. They are separate systems with separate scopes. GA4 reports credit across marketing channels for a defined "key event," using cross-channel path data, according to Google Analytics Help. Google Ads applies data-driven attribution within its own conversion actions. As of the current documentation checked on 2026-09-30, Google states that "data-driven attribution (DDA) is the default attribution model for most conversion actions." It applies to Search, Shopping, YouTube, Display, and Demand Gen ads, according to Google Ads Help.
Note practical limits. Per growthmethod.com, GA4 credit values are "only available within the interface and not exported to BigQuery." Attribution data can also change for up to nine days after conversion, as the model adds late path data, per that source. Check current platform limits directly when you build custom dashboards or reports. Vendor documentation changes over time.
Limitations
Data-driven attribution has four limits that matter for decision-making.
- It is not a causal test. One analysis states plainly that DDA "cannot answer causal questions, because it observes correlations in past paths rather than testing a counterfactual," per perform.digital.
- It cannot see outside its tracked channels. It largely misses offline-to-online effects, word of mouth, and brand equity, per growthmethod.com.
- It struggles when two channels move together. When search and social spend rise together, the model can assign shared effects to the wrong channel.
- It rewards existing structure. A channel that captures demand created by another channel can look highly credited when its true added value is lower. For example, branded search may catch users who first saw a display ad.
For a broader comparison of rule-based and algorithmic attribution models, see our guide to marketing attribution models.
When to Use MMM and Experiments
Use data-driven attribution for what it does well. It gives fast, always-on signal for campaign optimization and relative channel comparison inside a platform. Do not use it alone to justify a large budget shift between channels. That is a causal question, and DDA does not test causality.
For causal proof, use incrementality testing. This method withholds a channel from a random holdout group and compares conversion rates against an exposed group. One field guide states the calculation directly: "incremental lift = (treatment conversion rate − holdout conversion rate) / holdout conversion rate," according to clarigital.com. This method answers whether a specific channel drives conversions that would not have happened otherwise.
For the aggregate, cross-channel view, use marketing mix modeling. MMM uses historical time-series data and regression to estimate each channel's contribution to revenue, including offline channels like TV and radio. MMM does not need user-level tracking. This makes it resilient to cookie loss and privacy changes. However, MMM typically needs two to three years of data. It also produces results weeks or months after the period analyzed, according to clarigital.com.
One recommended structure pairs all three methods by schedule. Use attribution for daily optimization. Run incrementality tests quarterly per channel. Run MMM annually or twice a year for strategic budget decisions, according to clarigital.com. For a direct comparison of when each method fits, see our article on MTA versus MMM. For a step-by-step approach to building holdout tests, see our incrementality testing guide.
Conclusion
Data-driven attribution improves on rigid rules like last-click credit. It learns from real conversion and non-conversion paths. It remains a reporting tool, not a causal experiment. It needs enough conversion volume and clean tracking data to work well. Treat its output as a tactical signal, not final proof of what drove revenue.
If your team relies on data-driven attribution alone for budget decisions, align your reporting with causal measurement. Pair attribution with incrementality testing and marketing mix modeling. Together, these methods show both what happened and what would have happened without your marketing spend.

Stay in the loop
Get updates on new posts and resources.