Write the Holdout First in Your Incrementality Test Plan
Create an incrementality test plan covering the decision, hypothesis, assignment, outcome, power, contamination, analysis, and action rule.

An incrementality test plan is a written protocol. It establishes how you will measure causal lift before you spend media budget. Causal lift is the true net increase that your ads cause. Most teams fail because they design holdouts after campaigns go live. Teams also fail when they change success metrics after early results look poor.
To isolate true marketing causation, define three elements before you start the experiment:
- The holdout group
- The decision threshold
- The readout rule
Last-click attribution and multi-touch attribution credit channels based on user touchpoints. Attribution shows which ad clicks a customer had before a buy. Attribution models register correlation. Attribution models do not prove that an ad caused a conversion.
Marketing mix modeling (MMM) is a statistical method that estimates aggregate channel contributions across time. MMM needs experimental benchmarks to stay calibrated. An incrementality test isolates the true net addition of a channel. It compares an exposed group to an unexposed holdout group.
Use our incrementality testing guide to understand how these systems operate together.
       ┌────────────────────────┐
       │   Eligible Audience    │
       └───────────┬────────────┘
                   │
         Random Assignment
         (User, Geo, Time)
                   │
         ┌─────────┴─────────┐
         ▼                   ▼
  ┌──────────────┐    ┌──────────────┐
  │  Treatment   │    │   Control    │
  │    Group     │    │  (Holdout)   │
  │ (Ads Active) │    │  (Ads Off)   │
  └──────┬───────┘    └──────┬───────┘
         │                   │
         ▼                   ▼
  ┌──────────────┐    ┌──────────────┐
  │ Total Sales  │    │ Baseline     │
  │ (Y_treatment)│    │ Sales (Y_c)  │
  └──────┬───────┘    └──────┬───────┘
         │                   │
         └─────────┬─────────┘
                   ▼
       Causal Lift Calculation:
       Δ = Y_treatment - Y_control
Decision and Hypothesis
Start your marketing lift test plan with a commercial decision. The test informs this decision. Do not run an experiment only to collect data. Run an experiment to decide if you will scale, pause, or reallocate a marketing budget.
State the business decision first. For example, use this statement: "We will increase monthly budget by 30% if incremental return on ad spend (iROAS) is at or above 2.0. We will move spend to paid search if iROAS is below 1.2." Return on ad spend (ROAS) is revenue divided by ad spend. Incremental return on ad spend (iROAS) is causal lift revenue divided by ad spend. Early limits stop debate after the experiment.
This incrementality test plan template shows that written rules stop teams from moving target metrics after campaigns launch.
Write a clear hypothesis that you can test and prove false. Use this standard structure:
- Channel and tactic under test: Identify the exact platform, campaign type, and target audience.
- Causal claim: State that media exposure causes an increase in the primary business metric.
- Pre-agreed action: State the exact budget shift that will happen based on the estimated lift.
| Field | Example Specification | Why It Matters |
|---|---|---|
| Tested Channel | Paid Social Prospecting (Meta Advantage+ Shopping) | Avoids ambiguity about which campaigns must enter the holdout. |
| Primary KPI | First-party recorded order volume | Platform conversions introduce self-attribution bias. |
| Commercial Decision | Scale spend by 25% if iROAS $\ge$ 1.8; pause if iROAS < 1.0 | Locks organizational consensus before teams review data. |
| Falsifiable Hypothesis | Meta prospecting ads create net incremental orders at an acquisition cost below $45. | Gives a definitive true-or-false standard for the experiment. |
Unit and Assignment
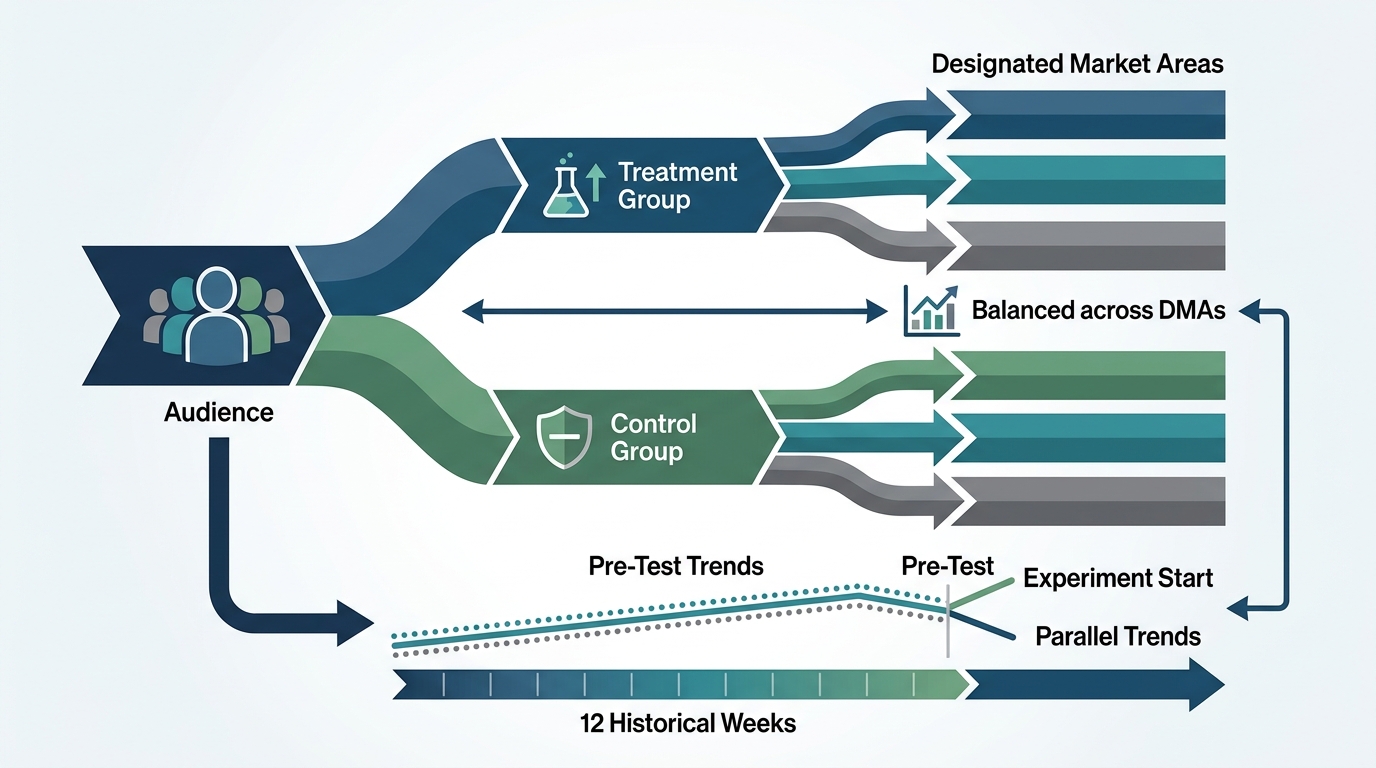
Your holdout test template must specify the unit of randomization. Selecting the wrong unit creates severe data contamination.
Marketers choose between two unit levels:
- User-level holdouts: You randomly assign individual cookies, mobile ad IDs, or customer accounts to treatment or control. This method gives high statistical power. However, ad blockers, cookie deprecation, and cross-device usage degrade user tracking over time. Platform native tools use ghost bidding techniques to flag holdout users without serving ads. This practice keeps costs low.
- Geographic units: You assign distinct geographical areas to treatment or control. Examples include Designated Market Areas (DMAs) or postal codes. Geo tests avoid identity loss. Geo tests operate cleanly across offline channels and walled gardens. They require matched market pairs or synthetic control methods to maintain baseline balance.
Use our guide on geo-experiments and MMM to select balanced market clusters. Verify that treatment and control regions show parallel baseline trends before you launch the test.
Outcome and Maturity
Choose one primary outcome metric to evaluate the result. Secondary metrics give context. However, you must base your commercial decision on the primary metric.
Do not use ad network reported conversions as your primary metric. Networks use internal attribution logic that claims credit for organic conversions. Organic conversions are sales that occur without ads. Instead, use an independent source of truth:
- Server-side completed purchases.
- Customer relationship management (CRM) qualified leads.
- Banked revenue from your payment processor.
Account for sales maturity and conversion lag. A customer who sees an ad today may not buy until two weeks later. If your purchase cycle requires 14 days, a seven-day test will fail to observe the full causal impact.
Plan three test stages:
- A pre-test baseline period
- A live intervention period
- A post-test cooldown period
During the cooldown period, turn off the campaign in all experimental regions or keep treatment conditions frozen. This window lets delayed orders mature without added media spend. If you shorten your readout window, you underestimate your actual return on investment.
Power and Duration
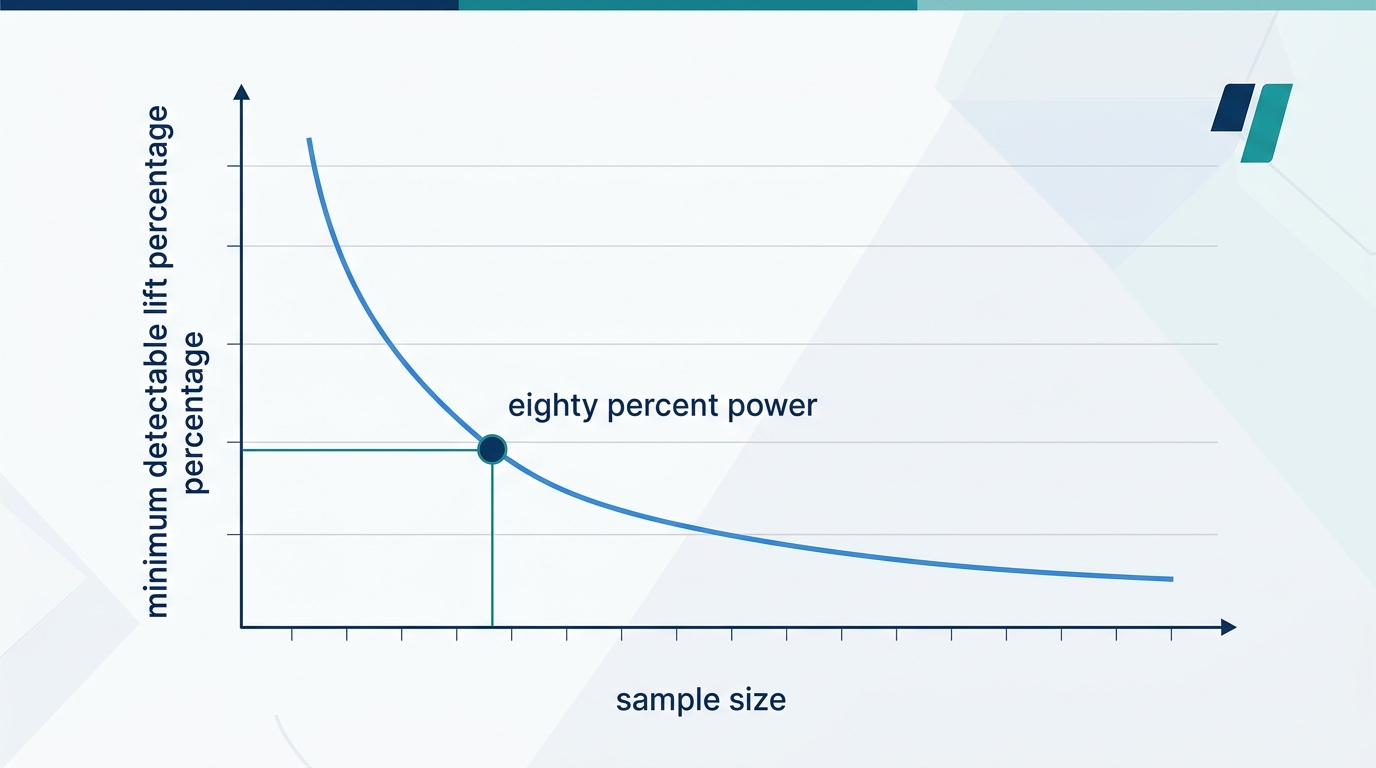
Underpowered experiments waste marketing spend and produce inconclusive results. Your incrementality test plan must establish the minimum detectable effect (MDE) before media teams alter campaign delivery.
The MDE is the smallest true lift that your test can detect with statistical confidence. It depends on three factors:
- Baseline conversion variance ($\sigma$).
- Target statistical power ($1 - \beta$, usually set to 0.80).
- Significance level ($\alpha$, usually set to 0.05).
Agency guides such as Amsive on defensible geo testing provide the standard analytical approximation for minimum detectable effect:
$$MDE \approx (z_{\alpha/2} + z_{\beta}) \cdot \sigma \cdot \sqrt{\frac{1}{n_{\text{test}}} + \frac{1}{n_{\text{control}}}}$$
In this formula, $z_{\alpha/2}$ is the critical value for your false positive rate. $z_{\beta}$ reflects your statistical power. The variable $n$ represents the sample size of each group.
       ▲
   MDE │
       │  \
  High │   \   Underpowered Region
       │    \  (Cannot resolve small lift)
       │     \
       │      ───────┐
   Low │             └──────── Valid Detection Zone
       │
       └────────────────────────────────────────►
       Low                                  High
                   Test Sample Size / Duration
Do not size your holdout group using unverified rules of thumb. Base your holdout size on the minimum lift that makes the channel economically viable. Measurement strategists at Sellforte on holdout group sizing highlight that your design must resolve your commercial decision boundary. The design must not merely detect whether lift is non-zero. If you need an incremental ROAS of 1.5 to break even, your test must have adequate power to detect that specific lift.
Run your incrementality test for a minimum of four weeks. Running tests for shorter durations exposes your data to day-of-week seasonality. Short tests also prevent you from collecting enough sample observations to reach statistical significance.
Contamination Controls
Contamination breaks the stable unit treatment value assumption (SUTVA). If marketing actions in your treatment group spill over into your control group, your measured lift will be inaccurate.
Enforce strict operational guardrails in your incrementality test plan:
- National promotions: Do not introduce sudden site-wide discounts or price increases during the test window. Price changes alter conversion rates unevenly across customer segments.
- Cross-channel spend spikes: Hold budgets steady on other major channels, such as brand search and linear television. If you increase brand search spending, it can capture demand that social campaigns created.
- Geographic audience leakage: In geo experiments, exclude border ZIP codes where local media broadcasts bleed into adjacent control markets.
- Targeting stability: Lock ad creative, audience parameters, and bidding targets inside the ad platform. Do not add new campaigns to the test account mid-flight.
Establish explicit stopping rules in your protocol. Only stop a test early if data delivery breaks completely or commercial losses exceed an agreed safety threshold. Never stop a test early simply because intermediate results reach nominal statistical significance. Early stopping inflates false positive rates and invalidates experimental conclusions.
Readout and Action Rule
The final section of your incrementality test plan details how you will calculate lift and execute decisions. Write your analysis code or spreadsheet formulas before you unblind the data.
Compute incremental revenue and incremental return on ad spend using standard causal formulas:
$$\text{Incremental Revenue} = Y_{\text{treatment}} - \left(Y_{\text{control}} \cdot \frac{Y_{\text{treatment, baseline}}}{Y_{\text{control, baseline}}}\right)$$
$$\text{iROAS} = \frac{\text{Incremental Revenue}}{\text{Spend in Treatment Group}}$$
Worked Example (Hypothetical Data)
Consider an e-commerce company testing a paid video campaign across two regional market clusters over four weeks. The media spend in the treatment region equals $50,000.
- Pre-test treatment baseline revenue: $200,000
- Pre-test control baseline revenue: $100,000
- Baseline scaling ratio: $2.0$
- Test-period treatment observed revenue: $260,000
- Test-period control observed revenue: $115,000
Calculate expected counterfactual revenue in the treatment market: $$\hat{Y}_{\text{counterfactual}} = $115,000 \cdot 2.0 = $230,000$$
Calculate incremental lift: $$\text{Incremental Revenue} = $260,000 - $230,000 = $30,000$$
Calculate iROAS: $$\text{iROAS} = \frac{$30,000}{$50,000} = 0.60$$
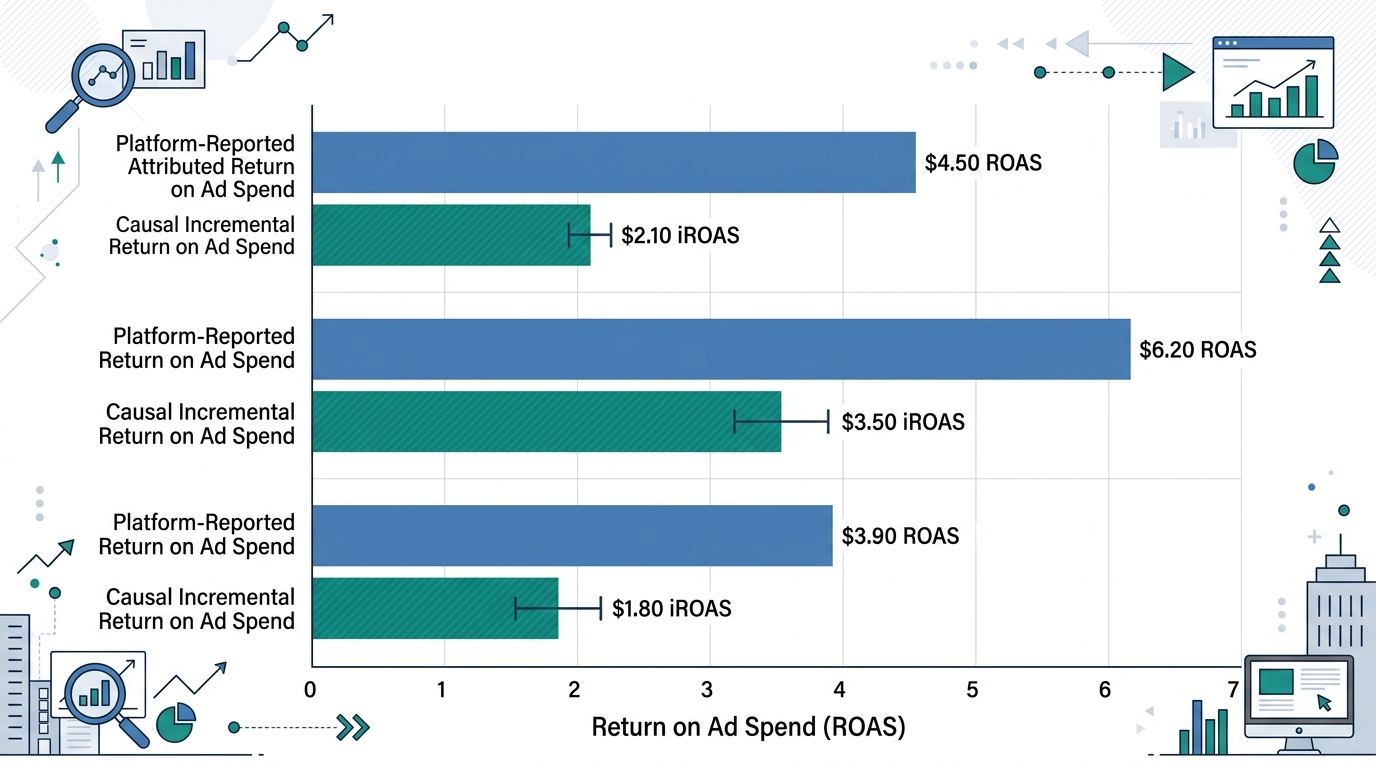
In this hypothetical example, platform attribution reported a ROAS of 3.2. However, the true causal iROAS is 0.60. The platform claimed credit for purchases that customers would have completed without viewing the ads.
When you finalize your analysis, compare results against independent benchmarks. Regional e-commerce holdouts reviewed by L&Y Decision on geo-testing methods emphasize that unadjusted comparisons between test and control regions inflate lift. This inflation occurs when brands fail to account for pre-existing baseline differences. Use difference-in-differences estimators or synthetic controls to remove underlying trends.
Evaluate your results using confidence intervals. Pause the channel immediately if your estimated iROAS confidence interval falls entirely below your viability target.
Attribution View (Correlated):
┌────────────────────────────────────────────────────────┐
│ Platform-Reported Revenue: $160,000 (ROAS: 3.20)       │
└────────────────────────────────────────────────────────┘

True Incrementality View (Causal):
┌───────────────────────────────┬────────────────────────┐
│ Baseline Revenue: $230,000    │ Lift: $30k (iROAS 0.6) │
└───────────────────────────────┴────────────────────────┘
Feed the results back into your overall measurement program after you calculate incremental performance. You can use these empirical lift factors as Bayesian priors to calibrate your marketing mix models.
Review our framework to validate MMM with incrementality experiments to keep your top-down and bottom-up measurement systems aligned.
Build Defensible Measurement
An incrementality test plan protects your marketing team from self-serving attribution models and internal confirmation bias. You generate trustworthy causal data when you write your holdouts, assign balanced units, calculate your minimum detectable effect, and establish your decision rules in advance.
Consider marginal return during your planning. Marginal return is the additional output that results from one additional unit of input.
Treat incrementality testing as a continuous calibration engine for your marketing budget, not as a one-time project.
Request an experiment design and MMM calibration review with our measurement specialists if you plan a test or need to benchmark models. We will evaluate your power calculations, check your market balance, and structure your incrementality readout rules.
Stay in the loop
Get updates on new posts and resources.