Can You Run Marketing Mix Modeling in Excel?
Learn how to prototype marketing mix modeling in Excel, including regression, adstock, diagnostics, and the limits of spreadsheet MMM.

You can build a working marketing mix model in Microsoft Excel. A spreadsheet can store weekly sales and cost data. It can calculate adstock and saturation formulas. It can also calculate a linear regression that estimates the contribution of each channel.
Marketing mix modeling (MMM) is a statistical method. It uses aggregate time-series data to estimate how each channel and external factor drives an outcome, such as sales. This Excel method is a valid prototype, not a toy. It is not a production MMM system. Treat this Excel model as a first test of your logic before you invest in code.
This article shows a workflow for MMM in Excel. It covers when Excel fits your work, how to organize your workbook, and how to build a baseline regression. It also explains how to calculate adstock and saturation curves, and how to check your model diagnostics. Finally, it shows when your model needs more advanced software.
When Excel Is Appropriate
Excel fits early work and simple projects. Use it when you have one or two years of weekly data. Use it when you have five or fewer media channels. It is useful when you must teach the method to stakeholders rather than deliver a final budget tool.
A step-by-step build in Excel is a known method for instruction. Published guides show regression, adstock, and diminishing returns on subscription data (github.com).
Excel does not fit when you need holdout validation across many periods. It does not fit when you need Bayesian priors or automated optimization across many channels. It struggles with nonlinear curve fitting when you use many parameters.
A production MMM system usually needs adstock, saturation, holdout validation, budget constraints, and experiment calibration. These requirements cause problems in a spreadsheet when the number of channels increases (landeros-labs.com).
MMM, attribution, and incrementality testing are three different measurement methods.
- Attribution assigns credit to customer touchpoints with user-level data.
- Incrementality testing measures the true causal effect of a channel. It isolates that effect by holding out users or randomizing exposure.
- MMM estimates channel effects from aggregate time-series data.
Each method answers a different question. Do not replace one method with another.
Weekly data is the standard industry unit. Monthly data hides too much variation. Daily data contains too much noise for stable estimates (readmedium.com).
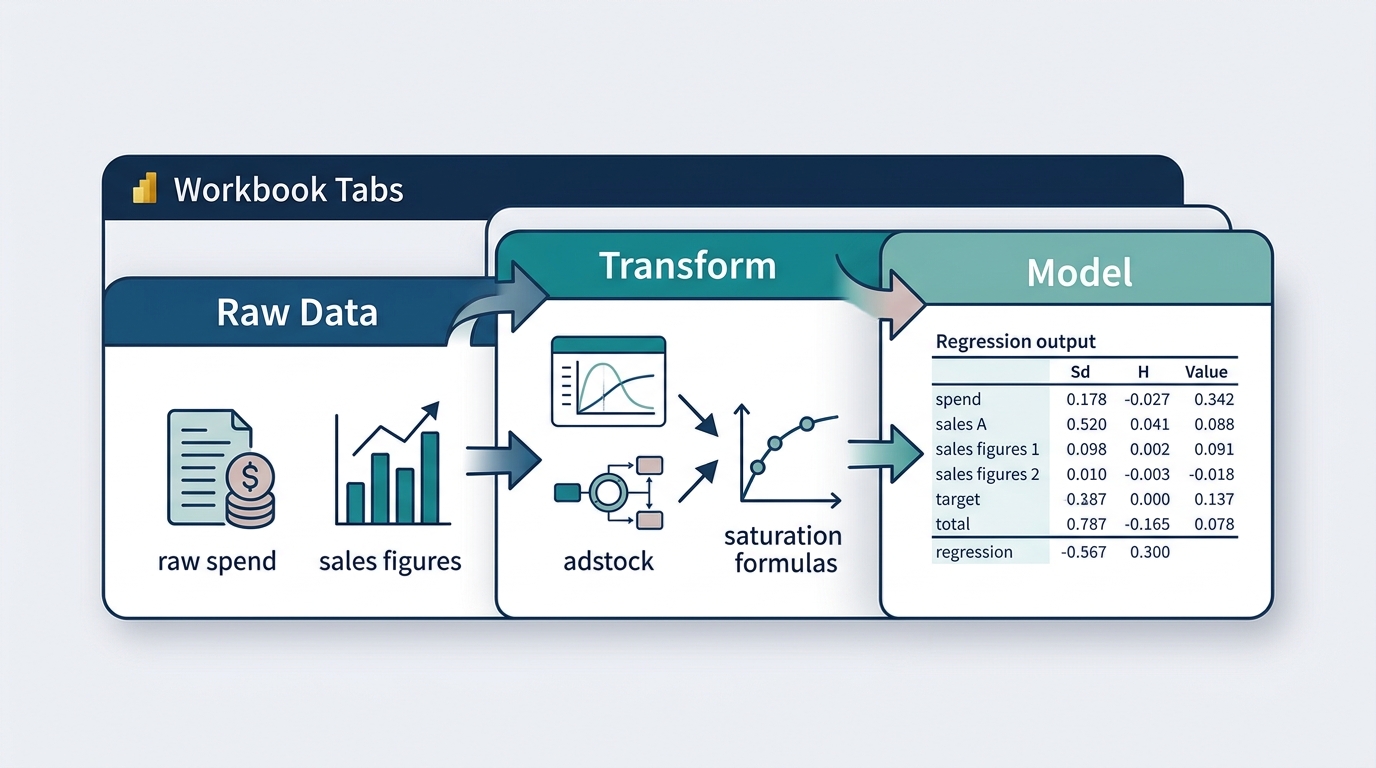
Workbook Structure
Divide the workbook into separate worksheets. This layout keeps raw data separate from transformed data and model outputs.
- Raw data tab: Enter weekly sales, weekly channel costs, and control variables like price, seasonality, and promotions.
- Transform tab: Calculate adstock and saturation for each media channel.
- Model tab: Store the regression output, coefficients, and predicted values.
- Diagnostics tab: Store residual charts, actual-versus-predicted plots, and goodness-of-fit statistics.
- Optimization tab (optional): Build a linear programming sheet to reallocate budgets within constraints, such as a channel spending limit (marketbridge.com).
Users often build this optimization tab with the Excel Solver tool. The marketing mix modeling template shows this tab structure with working formulas.
Baseline Regression
Start with a simple linear regression before you calculate transforms. This step gives you a baseline. It also confirms the initial relationships in your data.
Consider this hypothetical example. Your dependent variable is weekly transactions. Your independent variables are television cost, radio cost, and an intercept.
A baseline regression can return an intercept of 3. That value means you get 3 transactions with zero media spend. It can return a television coefficient of 0.19. That coefficient means each dollar of television spend adds 0.19 transactions (medium.com).
The Analysis ToolPak add-in in Excel runs this regression. It displays coefficients, R-squared values, and standard errors in one table.
This baseline model is useful, but it ignores two real effects. Media spend often works with a time delay. Also, each extra dollar usually returns less value than the previous dollar. Adstock and saturation calculations adjust for these behaviors.
Adstock and Saturation
Adstock models carryover effect. An advertisement from this week can cause sales in future weeks.
A standard formula multiplies the adstock of the previous week by a decay rate. Then it adds the spend of the current week.
One source uses this formula: media_transformed = (adstock at t-1 * beta) + spend at t. It raises that result to an alpha exponent for saturation (medium.com).
Saturation models diminishing returns. Media spend does not increase sales in a straight line. Initial spend often gives more return on ad spend than later spend in that week. Marginal return is the additional revenue that one extra dollar of spend generates.
A saturation curve lowers high spend values. This adjustment stops the regression from giving too much weight to high-spend weeks.
Decay rates vary by channel. Search media often has a fast decay. Television often has a slower decay that lasts several weeks (presenc.ai).
You will not know the correct decay and saturation parameters before you begin. Test different values for each parameter. Then select the values that produce the best model fit.
One source tested five decay values and five saturation values per channel. That test created 125 combinations for each media type (readmedium.com).
The table below shows a parameter search for one channel:
| Alpha (saturation) | Beta (decay) | Adjusted R² |
|---|---|---|
| 0.7 | 0.8 | 0.87 |
| 0.7 | 1.0 | 0.92 |
| 0.9 | 1.0 | 0.89 |
Select the row with the highest adjusted R-squared. Adjusted R-squared accounts for the number of variables in your model. It provides a fair comparison across parameter sets (marketbridge.com).
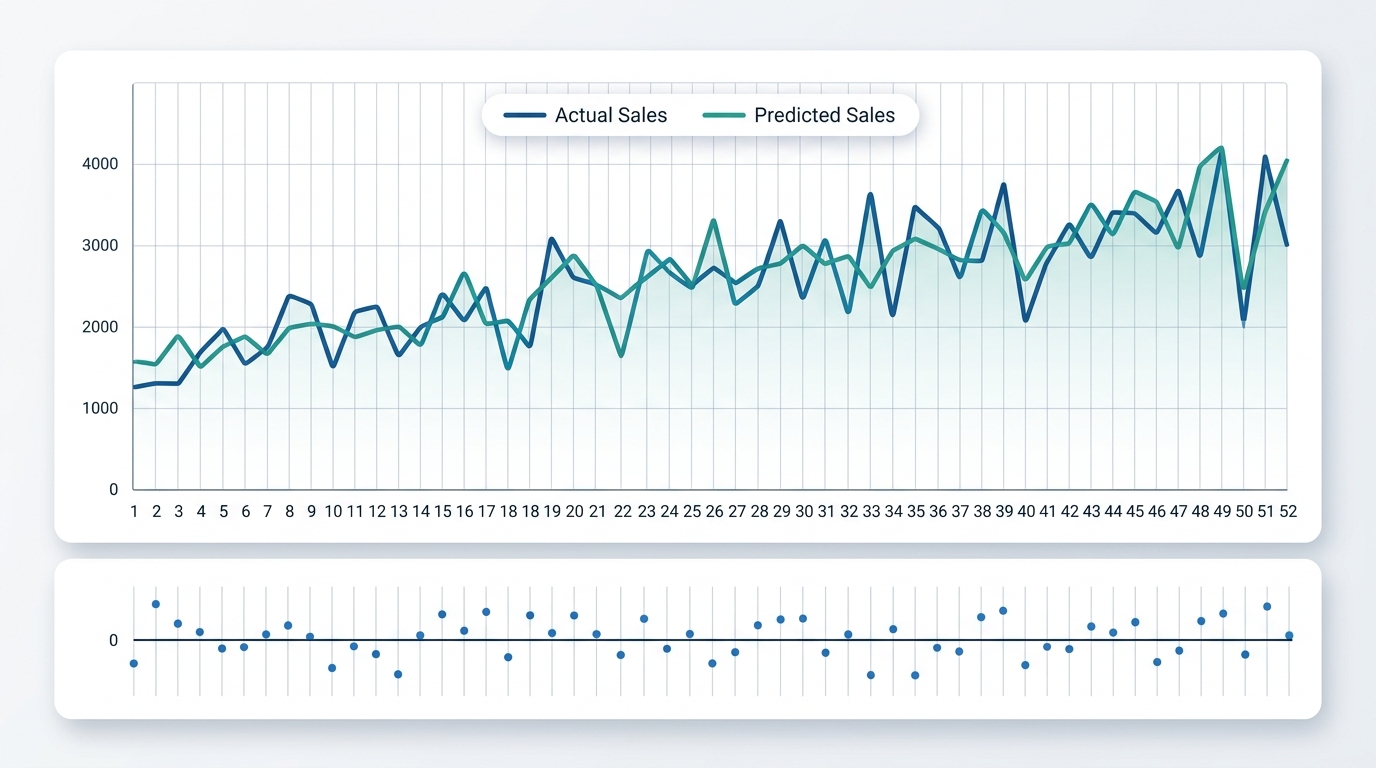
Diagnostics
A model can show a good fit and still be incorrect. Check your residuals. A residual is the difference between a predicted value and an observed value.
Good residuals show three characteristics:
- Constant variance over time.
- No correlation between consecutive weeks.
- A normal distribution (marketbridge.com).
Plot actual sales and predicted sales across time on a line chart. A good model follows the actual sales line closely across most weeks.
Residuals that stay positive or negative for many weeks reveal a missing variable. That variable can be a promotion, a price change, or a holiday (landeros-labs.com).
Report adjusted R-squared as your main fit statistic. Plain R-squared increases when you add useless variables. Adjusted R-squared penalizes added variables that do not improve model fit (marketbridge.com).
When to Move to Python or a Platform
Excel has clear limits. It does not easily support holdout validation. Holdout validation tests model accuracy on future weeks that the model did not process during training.
Excel cannot run Bayesian frameworks. These frameworks use prior knowledge and probability distributions instead of single point estimates. Spreadsheets also become unstable when you write complex nested formulas for many channels.
Move to Python, R, or a dedicated platform when you need these capabilities:
- More than six to eight media channels with individual adstock and saturation curves.
- Holdout validation on recent data (presenc.ai).
- Bayesian tools with convergence diagnostics, such as R-hat and effective sample size (presenc.ai).
- Calibration with lift tests to anchor the channel coefficient (presenc.ai).
- An automated pipeline that updates the model each month or quarter.
Standard open-source tools for this work include Robyn in R, and LightweightMMM or PyMC-Marketing in Python (presenc.ai).
The media mix modeling in Python guide shows a similar workflow with flexible tools. If you need probability estimates and formal uncertainty ranges, read the guide on Bayesian media mix modeling.
Conclusion
Excel can teach and prototype MMM logic. It handles adstock, saturation, regression, and residual checks. It is an acceptable tool when you have few channels and a short data history.
Excel cannot replace a production system when your channel count increases or your decisions carry high financial risk.
If your model exceeds the limits of Excel, contact a team that builds code-based marketing mix models. Complex media mixes need software designed for that scale.

Stay in the loop
Get updates on new posts and resources.