Media Mix Modeling Python Guide: Build MMM Step-by-Step
Master media mix modeling python techniques. A complete guide to building MMM from scratch, from data prep to budget optimization. Start your build today.
The spreadsheet is dead. Long live the script.
For years, marketing measurement lived in Excel. You had your pivot tables, your hard-coded formulas, and a lot of hope. But as data privacy laws tighten and cookies crumble, the old ways aren't just inefficient. They’re obsolete.
You need something robust. You need media mix modeling python solutions.
Building an MMM in Python gives you control. You aren't relying on a "black box" vendor telling you to spend more. You see the math. You own the code. You tweak the parameters based on your business reality, not a generic industry benchmark.
This guide isn't for the faint of heart. We aren't dragging and dropping here. We are building a statistical engine to predict revenue and optimize spend.
Let's get to work.
Why Python for MMM?
You could use R. You could use Julia. But Python wins for one reason: the ecosystem.
Python bridges the gap between data engineering (getting the numbers) and data science (crunching the numbers). Most marketing data pipelines already run on Python. Keeping your media mix modeling python scripts in the same language reduces friction.
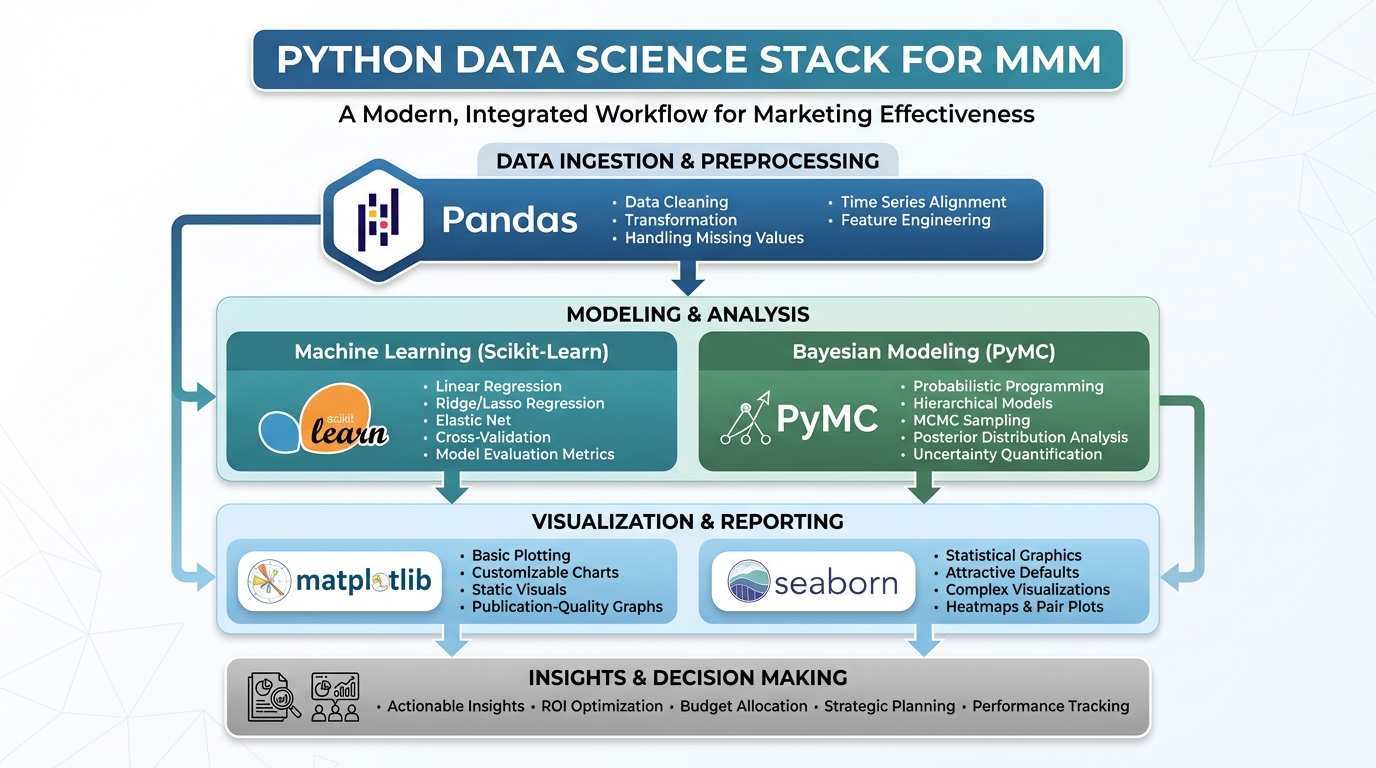
Plus, the libraries are unmatched. You have pandas for manipulation, scikit-learn for regression, and specialized libraries that make the heavy lifting easier. You can find extensive documentation on the official Python website regarding these libraries.
Before we write a single line of code, you need to understand the goal. We are trying to quantify the incremental impact of marketing channels on a KPI (usually sales). This is distinct from tracking individual user clicks. For a deeper dive on the difference, check out our guide on marketing attribution vs MMM.
!The Python technology stack required for building a media mix model.*
The Prerequisites
You need a clean environment. If you are starting from zero, install Anaconda or set up a virtual environment.
You will need these libraries:
- Pandas: The backbone of data structure.
- NumPy: For numerical operations.
- Matplotlib / Seaborn: To see what your data is doing.
- Scikit-learn: For the actual regression modeling.
- SciPy: For optimization functions.
If you are looking at more advanced Bayesian approaches later, you might look into PyMC or specific libraries like Google's Meridian. We wrote a full breakdown of that tool in our Google Meridian MMM guide.
Step 1: Data Collection and Cleaning
Garbage in, garbage out. It’s a cliché because it’s true.
90% of your time will be spent here. You need to aggregate data from every channel. Facebook, Google Ads, TikTok, TV, direct mail.
The Structure
Your dataset needs to be a time series. Weekly data is usually the sweet spot for media mix modeling python projects. Daily data is too noisy; monthly data doesn't provide enough data points for the model to learn.
Your DataFrame should look like this:
- Date: (Index)
- KPI: Revenue or Conversions (Target Variable)
- Media Variables: Spend or Impressions for each channel (Features)
- Control Variables: Price, Seasonality, Holidays, Competitor Activity.
Handling Missing Data
Do not just drop rows with missing data. In marketing, a "null" often means zero spend. Fill NaNs with 0 for media columns. For control variables, you might need interpolation.
According to research by Harvard Business Review, poor data quality costs organizations millions annually. Don't let your model be part of that statistic. Ensure your inputs are pristine.
Correlation Checks
Before modeling, run a correlation matrix. If Facebook spend and Google spend have a correlation of 0.95, your model won't know which one is driving sales. This is called multicollinearity. You might need to group channels or use regularization techniques.
For a broader look at how these variables interact, review our marketing effectiveness measurement guide.
Step 2: Feature Engineering (The Secret Sauce)
You cannot just feed raw spend into a linear regression. Marketing doesn't work that way. To build MMM model architecture that works, you must account for reality.
If you spend $100 today, you don't get all the sales today. Some happen next week. That's the Adstock Effect.
If you spend $1M, you don't get 10x the results of spending $100k. Efficiency drops. That's Diminishing Returns (Saturation).
Implementing Adstock in Python
We need to apply a decay function. The simplest is Geometric Decay.
def apply_adstock(x, decay_rate):
# x is the vector of media spend
# decay_rate is between 0 and 1
adstocked_x = []
prev = 0
for val in x:
current = val + (prev * decay_rate)
adstocked_x.append(current)
prev = current
return adstocked_x
You will need to test different decay rates for different channels. TV usually has a long half-life (high decay rate). Social ads burn out fast (low decay rate).
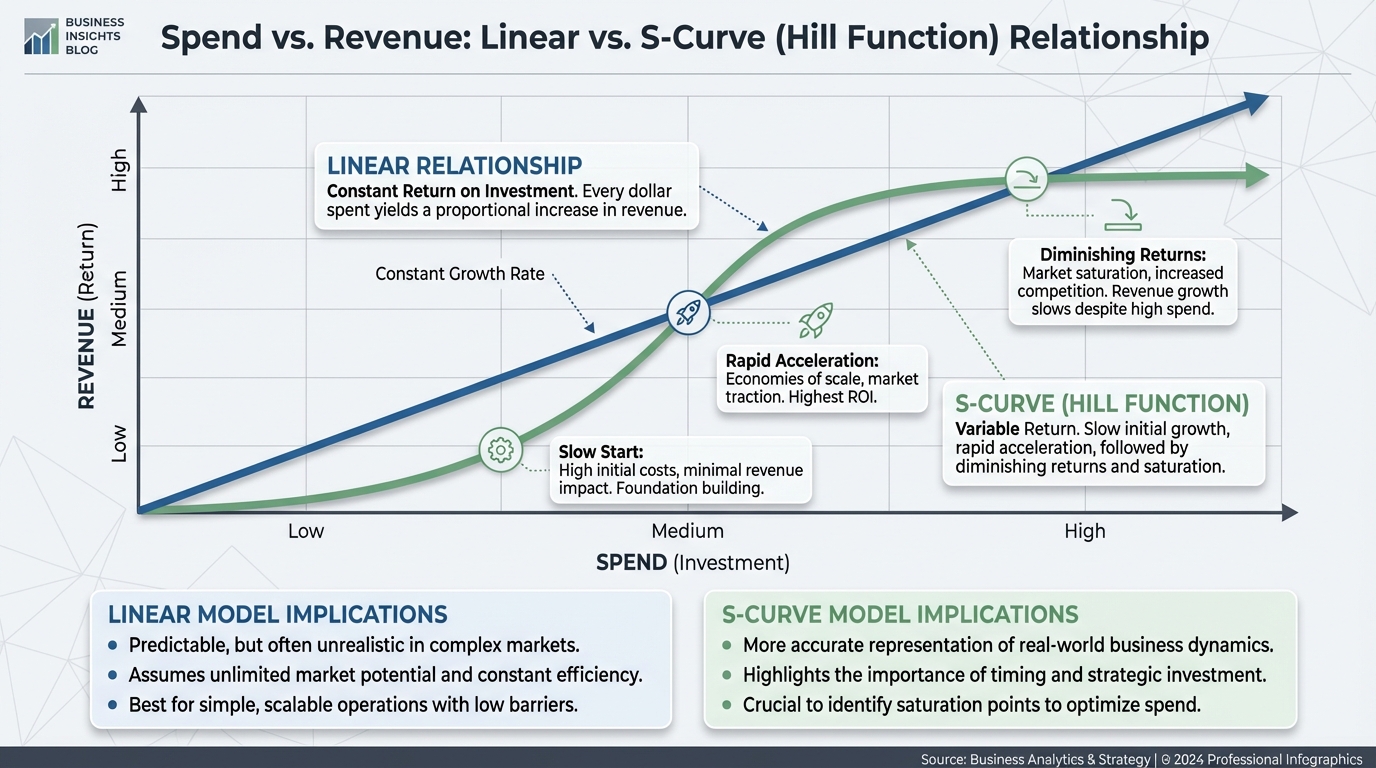
Implementing Saturation (Hill Function)
We need to transform the data so it curves off. The Hill function is the industry standard here. It creates an "S" curve.
It requires two parameters:
- Slope: How fast does it rise?
- Half-saturation: At what spend level do you get half the maximum impact?
[IMAGE: Chart showing Linear vs. S-Curve (Hill Function) relationship between Spend and Revenue]
Alt text: Graph comparing linear growth versus diminishing returns saturation curve.
!Graph comparing linear growth versus diminishing returns saturation curve.*
Step 3: Building the Model
Now we model.
The standard approach is Ridge Regression. Why not simple Linear Regression (OLS)? Because marketing data is messy and correlated. Ridge applies "regularization," which prevents the model from overreacting to small fluctuations or highly correlated variables. You can read more about the mathematics behind this in the Scikit-Learn documentation.
The Code Structure
Here is the conceptual flow using Scikit-Learn to build MMM model logic:
- Split Data: Train on the first 80% of weeks, test on the last 20%.
- Pipeline: Create a pipeline that scales the data (StandardScaler) and then fits the Ridge model.
- Hyperparameter Tuning: You don't know the perfect alpha (regularization strength) or the perfect adstock rates yet.
You have two options here. You can write loops to grid-search through parameters, or you can use a library like Optuna to find the best combination of decay rates and saturation points that minimize error.
The Bayesian Alternative
Ridge regression gives you a single answer. Bayesian modeling gives you a probability distribution.
Bayesian methods allow you to inject "priors." If you know from a lift test that Facebook has an ROI of 2.0, you can tell the model, "Start assuming Facebook ROI is around 2.0, and only change that if the data screams otherwise."
This is complex to code from scratch. This is why many data scientists turn to open-source libraries. Meta developed one specifically for this. You can read our analysis of it in the Meta Robyn guide.
Step 4: Validation and Accuracy
You built a media mix modeling python script. Is it any good?
Do not just look at R-squared. A high R-squared can mean you just overfitted the model to seasonality.
Key Metrics
- MAPE (Mean Absolute Percentage Error): How far off were the predictions on average? Anything under 10% is excellent. 10-20% is acceptable.
- DW Test (Durbin-Watson): Checks for autocorrelation in residuals. If your model's errors follow a pattern, you missed a variable (like a trend or competitor move).
The "Common Sense" Test
Look at the coefficients (the multipliers for each channel).
Are any negative? (Unless you have a terrible ad, spending money shouldn't decrease* sales).
- Do they match business intuition? (If Branded Search has a lower ROI than Display, something is wrong).
According to McKinsey, companies that integrate human intuition with analytics see a 15-20% improvement in marketing performance compared to those relying on black-box algorithms alone.
If your model looks weird, check your data. Did you account for out-of-home advertising? Did you miss a price change?
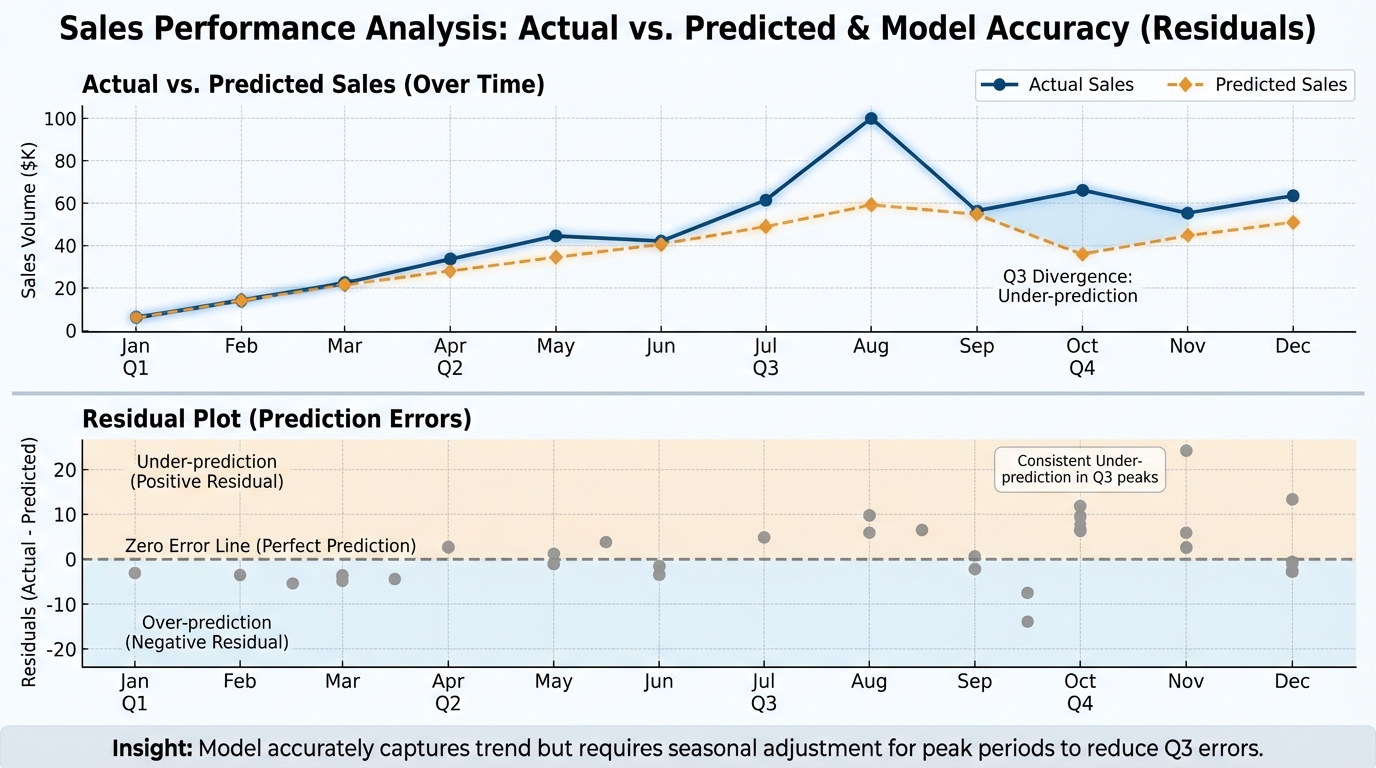
[IMAGE: Visualization of Actual vs. Predicted Sales over time with a residual plot underneath]
Alt text: Line chart showing the model's predicted sales tracking closely against actual historical sales.
Caption: A healthy model tracks trends closely but doesn't overreact to noise.
!Visualization of Actual vs. Predicted Sales over time with a residual plot underneath
This is the payoff. You didn't build a media mix modeling python script just to look at a chart. You want to save money.
You need to write an optimization script. This uses the curves you built in Step 2.
The Solver
You can use scipy.optimize.
- Objective: Maximize Revenue.
- Constraint: Total Spend <= Current Budget.
- Bounds: Don't let the model suggest spending $0 on a channel or $10M on a channel that usually gets $50k. Set realistic min/max bounds (e.g., +/- 20% of current spend).
The output will tell you to shift budget from saturated channels (low marginal ROI) to unsaturated channels (high marginal ROI).
This is the core of media budget optimization. It moves you from "guessing" to "investing."
The "Build vs. Buy" Reality Check
Writing this code is fun. Maintaining it is a nightmare.
Here is the lifecycle of an in-house marketing mix modeling python project:
- Month 1: Excitement. The model works!
- Month 3: The data engineer quits. The pipeline breaks.
- Month 6: The CMO asks for a daily update. You explain the model takes 4 hours to run and needs manual cleaning.
- Month 9: You are spending more time fixing bugs than analyzing strategy.
When to Build
- You have a dedicated data science team of 3+ people.
- Your media spend is massive ($50M+/year) and highly unique.
- You have zero budget for tools but unlimited budget for engineering hours.
When to Buy (or Hybrid)
For most brands, the maintenance cost outweighs the benefits of custom code.
Platforms like BlueAlpha eliminate the maintenance burden while providing the same statistical rigor. BlueAlpha doesn't just handle ingestion; it automates the entire statistical pipeline, typically helping brands identify 15-20% in wasted spend within the first month of deployment. You get the transparency of the code—it's not a black box—but the stability of a SaaS product.
If you are evaluating tools, you need to compare capabilities carefully.
- See how we stack up against other options in our Recast vs BlueAlpha comparison.
- Check out our Lifesight vs BlueAlpha guide for a look at attribution-heavy platforms versus pure MMM.
- For DTC brands, the Northbeam vs BlueAlpha breakdown is essential.
Advanced Considerations
Once you have the basics, the rabbit hole goes deeper.
Geo-Lift Calibration
Pure MMM can struggle to separate correlation from causation. The gold standard is "calibrating" your media mix modeling python code with experimental results. Run a lift test in Texas. Feed that truth into your Bayesian priors.
According to Gartner, integrating experimental results into marketing models is a critical differentiator for top-performing marketing teams in the coming decade.
Funnel Awareness
Not all dollars do the same job. YouTube builds awareness; Search captures demand. A flat model treats them the same. You need a hierarchical model or specific adjustments for funnel stage budget allocation.
B2B Nuances
If you are in B2B, the sales cycle is long. The lag isn't two weeks; it's six months. You need to incorporate pipeline data. Read our guide on account-based marketing attribution to see how to handle high-value, low-volume data.
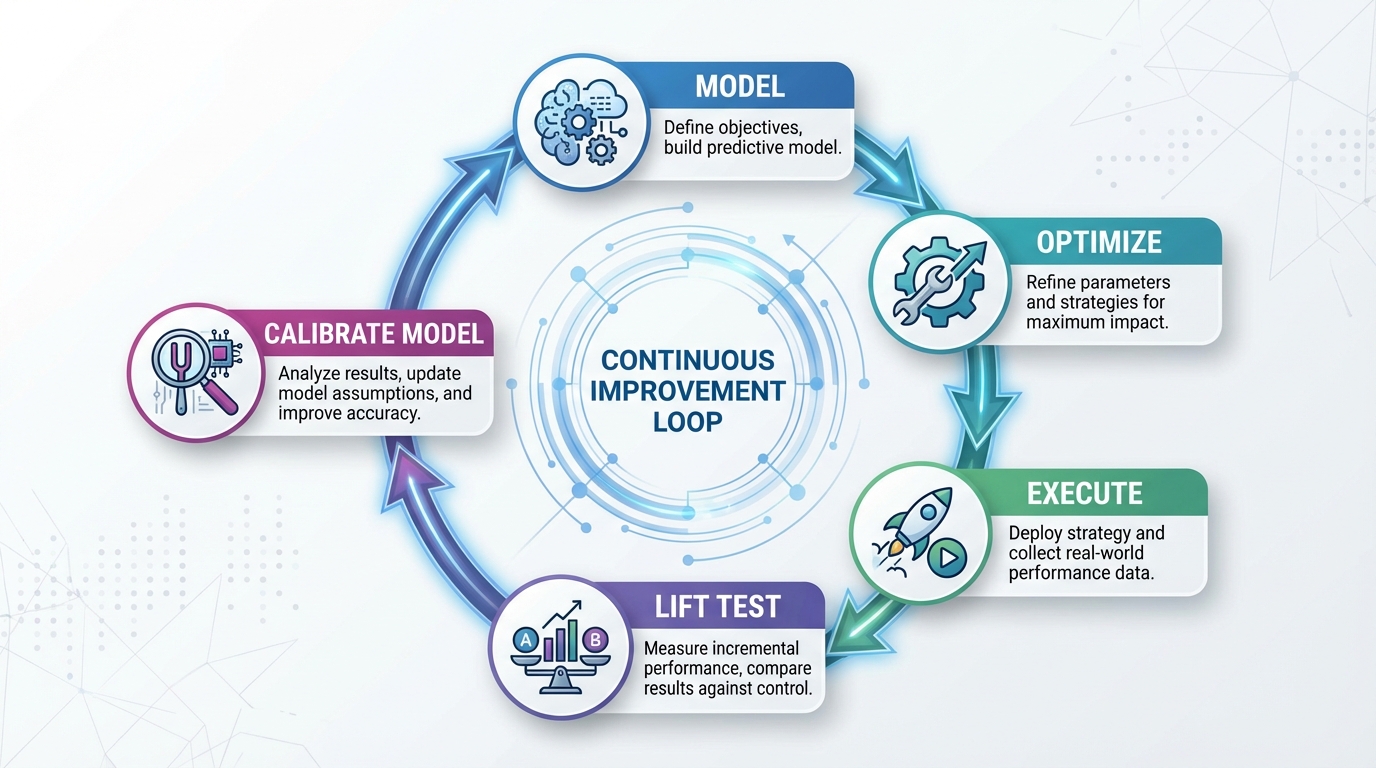
[IMAGE: Infographic showing the feedback loop: Model -> Optimize -> Execute -> Lift Test -> Calibrate Model]
Alt text: Circular process diagram showing how experiments improve model accuracy.
Caption: Continuous calibration with real-world experiments prevents model drift.
!Circular process diagram showing how experiments improve model accuracy.*
Getting the model to run on your laptop is step one. Getting it to run automatically in the cloud is step two.
You will need to containerize your script (using tools like Docker), set up a scheduler (like Airflow), and dump the results into a dashboard (Tableau/Looker). We cover the logistics of this in our article on how to deploy a media mix model.
Conclusion
Building a media mix modeling python solution is a superpower. It forces you to understand the mathematics of your growth. It removes the veil of mystery from marketing performance.
But remember: the code is just a tool. The goal is better decisions.
Whether you stick with your custom script or eventually migrate to a platform like BlueAlpha to scale your analysis, the principles remain the same. Clean data. Smart feature engineering. Constant validation.
Start small. Model one channel. Then expand. The data is waiting.
Frequently Asked Questions
What libraries do I need for media mix modeling python projects?
To build a robust MMM, you need Pandas for data manipulation, NumPy for calculations, Scikit-learn for regression modeling (like Ridge), and Matplotlib/Seaborn for visualization. For advanced Bayesian modeling, libraries like PyMC or NumPyro are essential.
How much historical data do I need for MMM in Python?
Ideally, you need at least two years of weekly data (104 data points). This allows the model to capture seasonality (year-over-year trends). If you have less than a year, the model will struggle to differentiate between a seasonal spike (e.g., Black Friday) and ad performance.
Can I use Excel instead of Python?
Technically, yes, for very simple linear regressions. But Excel crashes with large datasets and cannot handle complex transformations like Adstock or Hill functions efficiently. Python for marketing analytics automates the repetitive cleaning and allows for far more accurate, non-linear modeling.
What is the difference between MMM and MTA?
MTA (Multi-Touch Attribution) tracks individual user paths using tracking pixels. MMM (Media Mix Modeling) looks at aggregate data (total spend vs. total sales) to find patterns. MMM is privacy-safe and works without cookies, making it the future-proof choice. For a detailed breakdown, read our MTA vs MMM comparison.
How often should I update my model?
In a perfect world, weekly. However, a full model refresh usually happens monthly or quarterly. If you use an automated platform like BlueAlpha, you can get rolling updates. If you build it manually in Python, expect to spend a few days each month cleaning new data and re-running the script.