View-Through Attribution Does Not Prove Impact
Learn how view-through attribution counts post-impression conversions, where over-crediting occurs, and how to validate display and video impact.

View-through attribution counts a conversion when a person sees an ad, does not click it, and buys later. This sequence shows a link in time. It does not show that the ad caused the sale. A post-view conversion only shows that an ad server logged an ad view for a user profile before that user completed an action. It does not show that the ad changed the behavior of the user. Advertisers who treat view-based credit as proof of impact over-invest in display ads and paid social remarketing.
These tactics target users who plan to buy anyway. Marketers must check post-view conversions with care. Digital ad platforms report large numbers of view-through conversions because their software tracks ad deliveries across millions of websites and apps. To measure true business growth, you must separate passive ad views from real commercial impact.
How view-through attribution works
A view-through conversion occurs through automatic event logging. When a digital publisher shows an ad, the publisher code sends a view record. The ad platform stores this view record with an identifier, such as a device ID, an IP address, or a platform account token.
The process follows a fixed order:
- The publisher shows the ad creative on the screen of the user.
- The ad server records a view timestamp for that specific user identity.
- The user leaves the page without clicking the ad.
- The user completes an action, such as a purchase or lead form, on the advertiser site at a later time.
- The advertiser conversion tag or server-to-server link sends the purchase event back to the ad network.
- The ad network matches the purchase timestamp to the earlier view timestamp.
- The platform credits the campaign with a view-through conversion if the time gap falls within the set lookback limit.
This sequence only records a passive ad view. As pixellint.org explains regarding impression logging mechanics, view-through tracking works backward. It matches conversion records to view logs after the event occurs. It does not show whether the consumer noticed the ad, read the text, or felt any influence from the ad message.

Windows and identity
The length of the lookback window controls how many conversions an ad network claims. A view-through attribution window sets the maximum time allowed between the recorded ad view and the user conversion.
If an advertiser sets a 1-day view window, the ad network only claims purchases that happen within 24 hours of an ad view. If the advertiser sets a 30-day view window, the ad network takes credit for any purchase made during the full month after the ad view. A longer window raises the reported conversion count. But it lowers the chance that the ad caused the sale. You can review standard window lengths in our guide to marketing attribution windows.
Identity matching has become harder. Web browsers now limit third-party cookies, and mobile operating systems limit cross-app tracking. Because of these limits, ad networks use combined event data, probable device links, and modeled conversions. As adlibrary.com notes in their evaluation of attribution defaults, modern platform windows combine direct matches with modeled estimates. These modeled systems assume that an ad view occurred even when no direct technical link exists.
Overlap and over-crediting
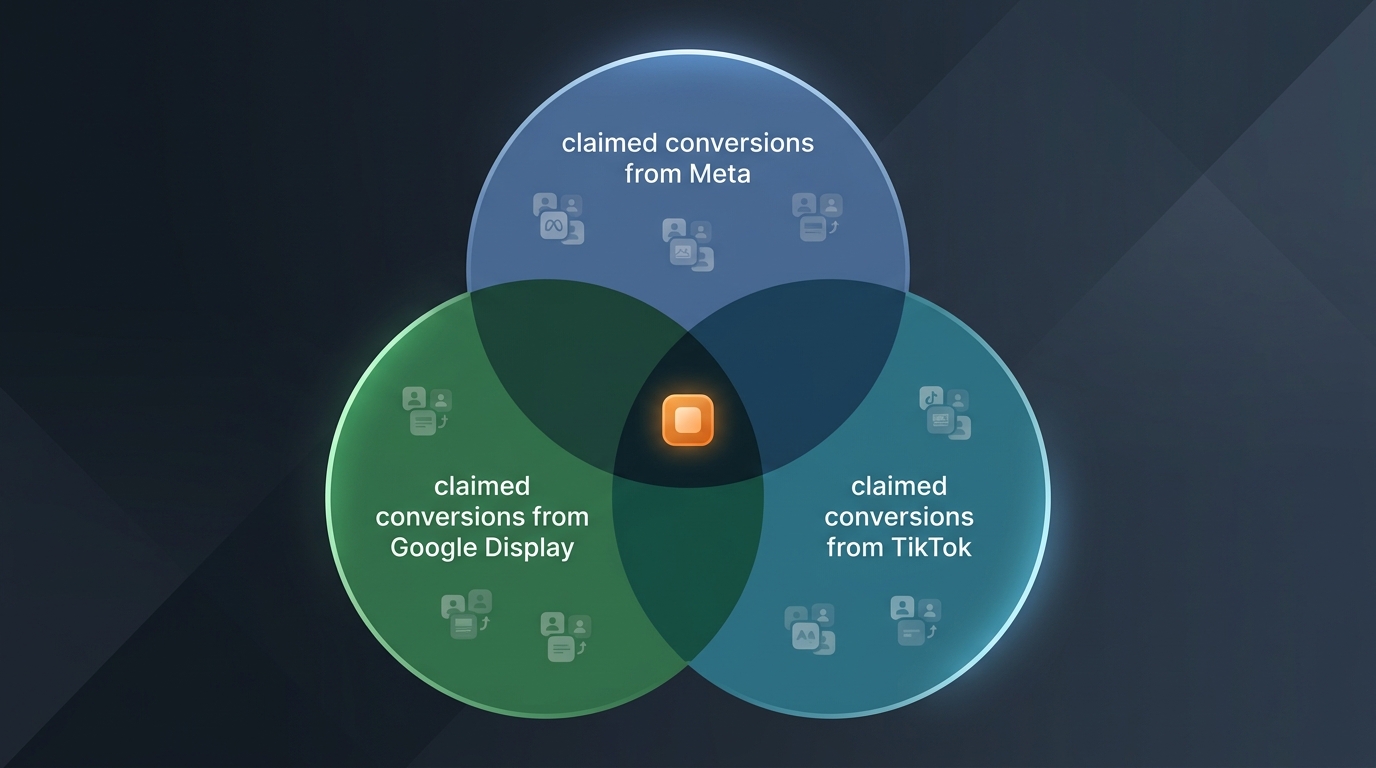
Ad networks calculate view-through numbers alone. Each ad vendor runs a closed system. Because these systems do not share data, multiple vendors often claim full credit for the same customer purchase.
Consider a practical example with three separate ad networks:
| Channel | User Action | Window Used | Conversion Claimed |
|---|---|---|---|
| Meta | Ad impression in feed at 09:00 | 1-day view | 1 conversion |
| Google Display | Banner rendered on a news site at 14:00 | 1-day view | 1 conversion |
| TikTok | Video rendered on a feed at 17:00 | 1-day view | 1 conversion |
| Direct Web Visit | User buys a jacket on the site at 20:00 | N/A | Total: 1 actual sale |
In this case, one customer bought one jacket. Yet the three ad platforms report three conversions in total. As cometly.com documents regarding attribution overlap, cross-platform view attribution causes heavy double counting because each ad network claims the conversion on its own.
This structural overlap causes severe over-crediting for retargeting campaigns. Retargeting systems deliberately show ads to people who visited your checkout page or left items in a shopping cart. These users already show strong buying intent. You can show a display ad to a cart abandoner who plans to buy that night. The ad platform still takes credit for the sale. The campaign reports a high return on ad spend (ROAS, the revenue earned per dollar spent on ads), but it created zero extra sales.
Channel examples
Different ad platforms use different default measurement settings. Advertisers who do not change these defaults risk judging campaigns by mismatched standards.
Meta view-through attribution
Meta uses a default attribution setting of 7-day click and 1-day view. A user can scroll past an Instagram ad and buy an item on a laptop 12 hours later. Meta logs that purchase as a view-through conversion. For high-volume consumer goods, this 24-hour window captures many routine purchases that would happen without the ad view. As voltagemedia.com shows in their attribution inflation research, counting loose 24-hour view conversions often credits organic or direct sales.
Google Display and YouTube
Google Ads handles display attribution and video attribution in different ways. Google often sets the default view-through attribution window for Google Display Network campaigns to 30 days. As foundgrove.com observes regarding view-through mechanics, Google places display view-through numbers in separate report columns. It excludes users who clicked another ad from the same account. However, YouTube campaigns can count conversions after brief video views, even when the user clicks skip after two seconds.
TikTok
TikTok uses a default 7-day click and 1-day view window. Because TikTok feeds move fast, users can register ad views on their screens within milliseconds. Fast scrolling creates a high volume of logged views for users who never saw the visual content.
Similar measurement problems exist when you assess physical ad channels. You can learn how offline ad measurement compares by reading our out of home advertising tracking guide.
Validation methods
Do not accept raw post-view numbers as proof of media performance. Use formal validation methods to calculate true lift (the real increase in sales caused by an ad).
1. Randomized incrementality testing
Incrementality testing is the most direct way to prove cause and effect. In an incrementality test, you split your audience into two random groups:
- The test group can see your impression-based ads.
- The control group cannot see your impression-based ads.
You track the total conversions across both groups over the same exact period. If the test group makes more conversions than the control group, that difference is your incremental view-through conversions. As mixedmetrics.com emphasizes in their incrementality guide, controlled holdout tests prove true cause and effect instead of simple patterns. You can design these tests with audience splits or geographic regions, as explained in our incrementality testing guide.
You can express the incrementality rate with this simple formula:
$$\text{Incrementality Rate} = \frac{\text{Conversions in Test Group} - \text{Conversions in Control Group}}{\text{Conversions in Test Group}}$$
If you record 1,000 conversions in your test group and 850 conversions in your control holdout group, your incrementality rate is:
$$\frac{1{,}000 - 850}{1{,}000} = 0.15 \text{ (or } 15%)$$
This result shows that 85% of your post-view conversions would have happened without any ad view.
2. Marketing mix modeling (MMM)
Marketing mix modeling (MMM) is a statistical method that uses large-scale historical data to estimate the contribution of each channel. An MMM model studies spend changes, ad views, pricing, economic shifts, and baseline sales over long periods.
Attribution systems assign credit to single user paths. In contrast, MMM estimates how changes in ad view volume relate to changes in total sales volume. This statistical method isolates true baseline sales (sales that occur without any ad influence). It stops remarketing channels from claiming credit for customers who buy through normal brand demand.
3. Comparing attribution, incrementality, and MMM
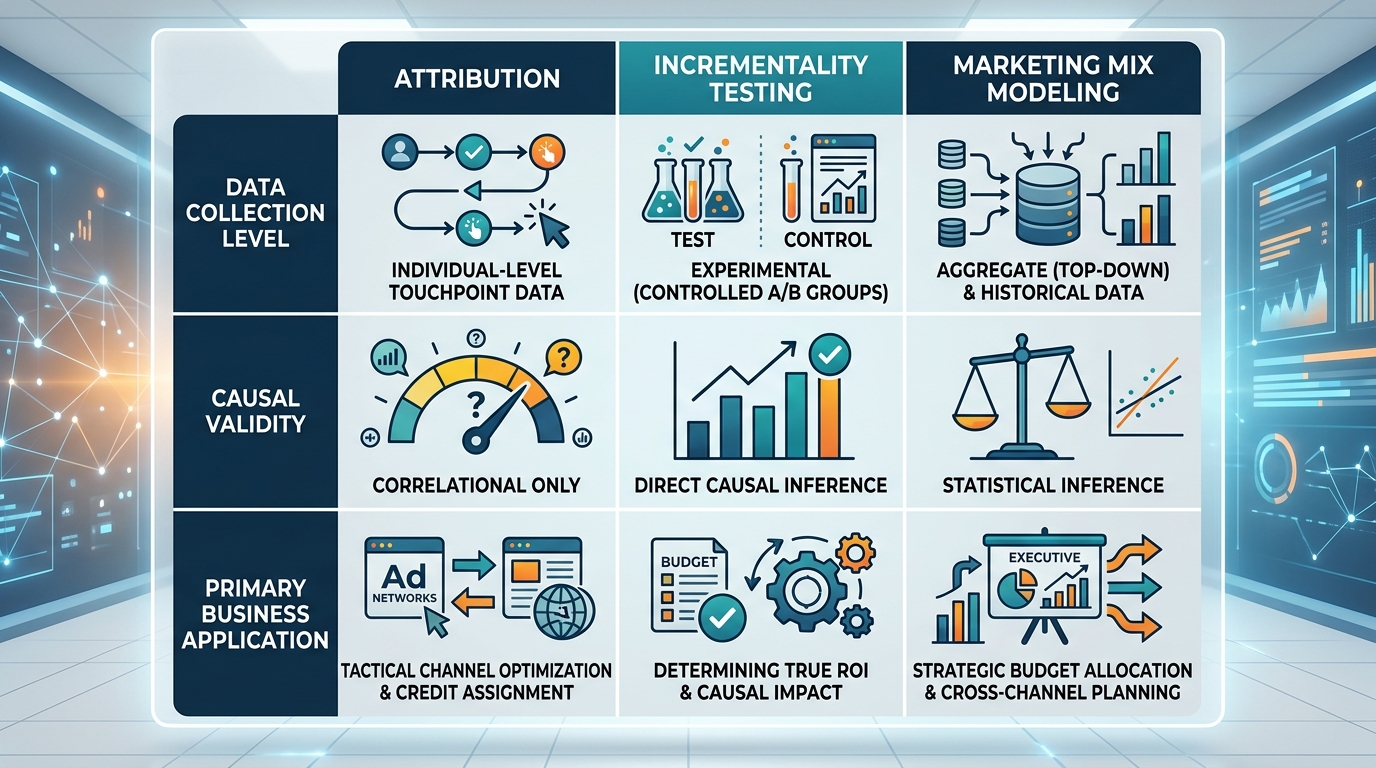
These three measurement methods serve different purposes:
- Attribution: Describes observed digital touchpoints along a path. It helps day-to-day media buyers improve ad creative and target groups within an ad platform.
- Incrementality: Proves whether ad views caused an immediate lift in sales through controlled tests.
- Marketing Mix Modeling: Evaluates high-level budget choices across all marketing channels without the need for digital tracking tags.
Reporting rules
If you report view-through conversions to executives, use strict reporting standards. Do not combine click conversions and view conversions into one metric.
Follow these four operating rules:
- Keep metrics in separate columns. Always show click-through conversions, raw view-through conversions, and total transactions in separate columns. Do not add raw view-through conversions into standard conversion totals.
- Apply a discount factor to view conversions. If you must blend view-through numbers into performance dashboards, discount them heavily. As analyticsafe.com outlines for performance reporting, many teams apply a 50% to 80% discount factor to post-view values. This factor accounts for natural customer intent.
- Shorten all view windows. Reduce platform view windows from 7 days or 30 days down to a 24-hour limit. A 1-day window reduces false claims and limits the effect of cross-channel overlap.
- Calibrate reports against test results. Use your incrementality test results to adjust post-view conversion values in monthly reports. Suppose a test shows an incrementality rate of 20% for your display campaign. Multiply your raw view-through conversion value by 0.20 before you calculate return on ad spend.
Conclusion
View-through attribution gives useful day-to-day visibility into ad delivery. But it does not measure true commercial lift. Unadjusted post-view numbers overstate campaign success and lead to poor media choices. Modern marketing teams must check digital view numbers with incrementality holdout tests and statistical mix models.
MediaMixModel.com provides an objective review of your impression-based media portfolio. Our team helps you audit attribution settings, build geographic holdout tests, and create mix models. These tools reveal your true incremental return. Contact our measurement specialists today to check your media impact.
Stay in the loop
Get updates on new posts and resources.