Brand Marketing Measurement: Proving ROI to Executives
Stop guessing. Learn how brand marketing measurement connects upper-funnel activity to bottom-line revenue. Prove value and win over skeptical CFOs today.
Your CFO doesn't care about "brand love."
They don't care about impressions, engagement rates, or how many people liked your latest Instagram reel. They care about revenue, cash flow, and profit margins.
For years, marketers have struggled to bridge this gap. You know brand building works. You know that turning off top-of-funnel spend eventually kills demand. But proving it with hard numbers has been nearly impossible.
This is where brand marketing measurement fails most organizations.
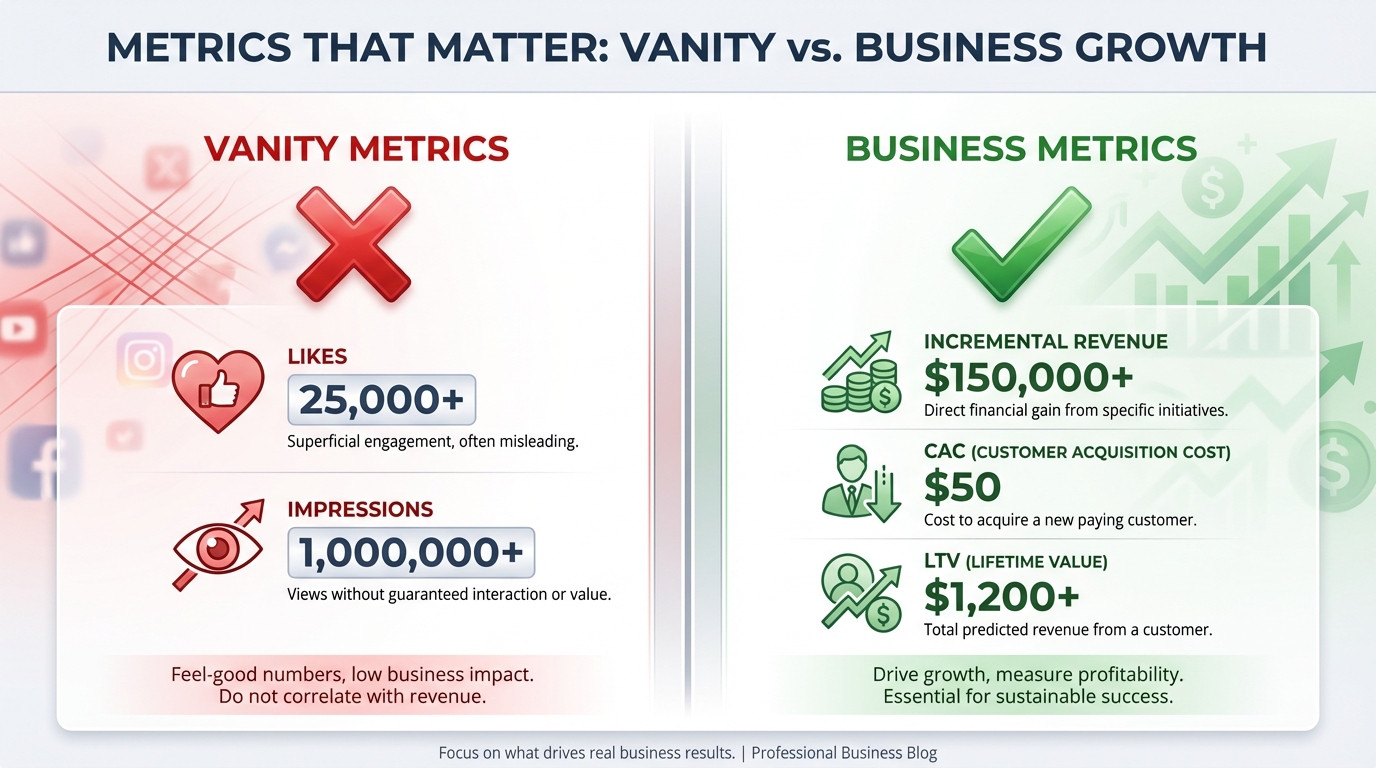
Most teams rely on vanity metrics or flawed attribution models that give 100% of the credit to the last click. This leads to a dangerous cycle: you cut brand spend to fund performance marketing, efficiency looks good for a quarter, and then your baseline sales collapse.
It’s time to fix your measurement strategy. This guide breaks down exactly how to measure the invisible and prove the ROI of brand marketing to your executive stakeholders.
!Comparison between vanity metrics and business metrics for brand measurement.*
The Attribution Trap: Why You Can't "Track" Brand
If you try to track a billboard the same way you track a Facebook ad, you will fail.
Digital tracking relies on a direct, linear path: User clicks ad -> User buys product. But brand marketing doesn't work that way. It works by building memory structures—what the Ehrenberg-Bass Institute defines as "mental availability"—that influence a purchase decision weeks or months later.
When you rely solely on click-based attribution, you undervalue anything that doesn't demand an immediate response. This is why so many companies over-invest in branded search and under-invest in growth channels.
The Death of the Cookie
The problem is getting worse. Privacy changes from Apple (iOS 14+) and Google (Privacy Sandbox) have shattered the tracking chains marketers used to rely on. You can no longer see the full picture.
According to research by Gartner, a significant percentage of marketers admit their attribution models fail to capture the true value of their media mix. The data is fragmented, and the "user journey" is now a black box.
You need a methodology that doesn't rely on tracking individual users. You need a top-down approach.
For a deeper dive into why traditional tracking is failing, read our MTA vs MMM marketing attribution comparison.
The Three Pillars of Modern Brand Measurement
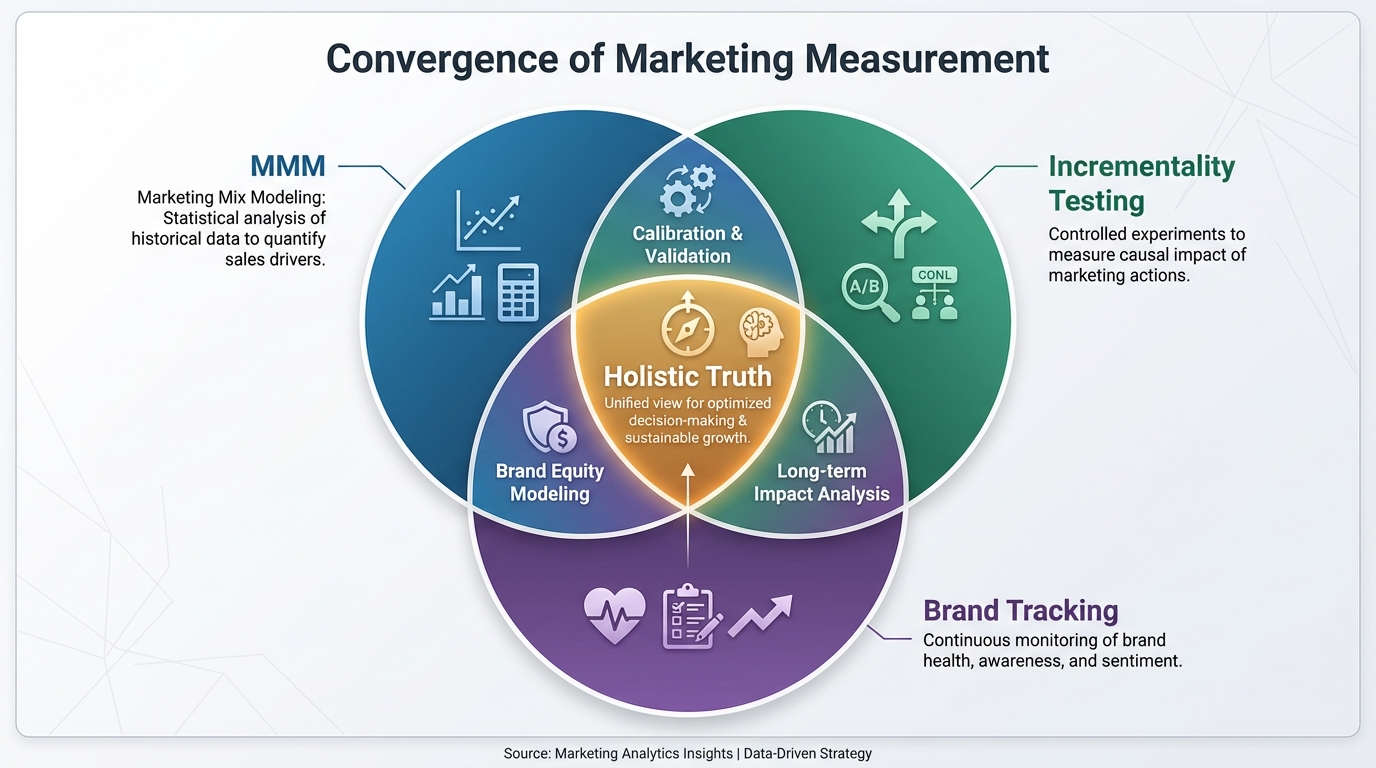
You cannot rely on a single source of truth. Effective brand marketing measurement requires triangulation. You need to combine three specific methodologies to get a clear picture of performance.
1. Media Mix Modeling (MMM)
This is your statistical engine. MMM uses historical data to determine the relationship between marketing spend and sales. It doesn't care about cookies or clicks. It looks at spikes in revenue and correlates them with your media activity.
MMM is the only reliable way to measure the incremental impact of offline channels and broad digital campaigns. It tells you, "When we spent $50k on TV, baseline sales rose by 12% over the next three months."
If you are new to this concept, start with our media mix model marketing attribution guide.
2. Incrementality Testing (Geo-Lift)
MMM gives you the correlation; testing gives you the causation.
You run a brand campaign in Ohio but keep it dark in Michigan. If Ohio sees a sales lift significantly higher than Michigan, you know your brand marketing caused it. This is the gold standard for proving ROI.
Leading organizations use these tests to calibrate their models. By feeding test results back into the MMM, you make the model smarter over time. For more on ensuring your marketing is actually working, check out our marketing effectiveness measurement guide.
3. Brand Tracking & Surveys
This measures the "soft" metrics that lead to hard results. Are people aware of you? Do they consider you a premium option?
While these don't pay the bills directly, they are leading indicators. If brand awareness drops today, your Customer Acquisition Cost (CAC) will rise tomorrow. Analysts at Forrester consistently note that brand perception is a precursor to market share shifts.
[IMAGE: Venn diagram showing three overlapping circles: "MMM", "Incrementality Testing", and "Brand Tracking". The center intersection is labeled "Holistic Truth".]
Alt text: The three pillars of brand measurement triangulation.
!The three pillars of brand measurement triangulation.*
Media Mix Modeling is the backbone of brand marketing measurement. It allows you to separate your "baseline sales" (sales that would happen without any marketing) from "incremental sales" driven by specific channels.
When you run an effective brand campaign, you should see two things happen in your model:
- Short-term lift: A small bump in immediate sales.
- Long-term baseline growth: The floor of your sales chart should rise over time.
This second point is critical. Performance marketing rents sales; brand marketing builds equity.
The Lag Effect
Brand marketing has a delayed impact. A video ad viewed today might trigger a purchase three weeks from now.
Sophisticated models account for "adstock"—the prolonged effect of advertising exposure. If your model only looks at same-week conversions, you are calculating ROI incorrectly.
For a technical breakdown of how to set this up, review our guide on how to deploy a media mix model.
Measuring Hard-to-Track Channels
Brand money often goes to channels that defy click-tracking. Podcasts, Out-of-Home (OOH), and Influencer marketing are notorious black holes for Google Analytics.
However, MMM excels here. By analyzing spending patterns against regional sales data, you can isolate the revenue contribution of these channels.
- Influencers: Don't just count coupon code redemptions. Look at the total lift during the campaign period. See our influencer marketing performance measurement guide.
- Billboards/OOH: Map OOH spend by zip code and correlate with regional sales velocity. Check our out of home advertising tracking guide.
Moving Beyond Vanity Metrics
To speak your CFO's language, you must translate marketing activity into financial outcomes. You need to conduct a proper analysis of your returns. Read our marketing ROI analysis guide for the foundational formulas.
Stop reporting on:
- Reach
- Impressions
- CPM (Cost Per Mille)
- Engagement Rate
Start reporting on:
- Incremental ROAS (iROAS): The return on ad spend that wouldn't have happened otherwise.
- CAC Payback Period: How fast you make your money back.
- Marketing Efficiency Ratio (MER): Total revenue divided by total marketing spend.
- Baseline Sales Growth: The increase in organic demand over time.
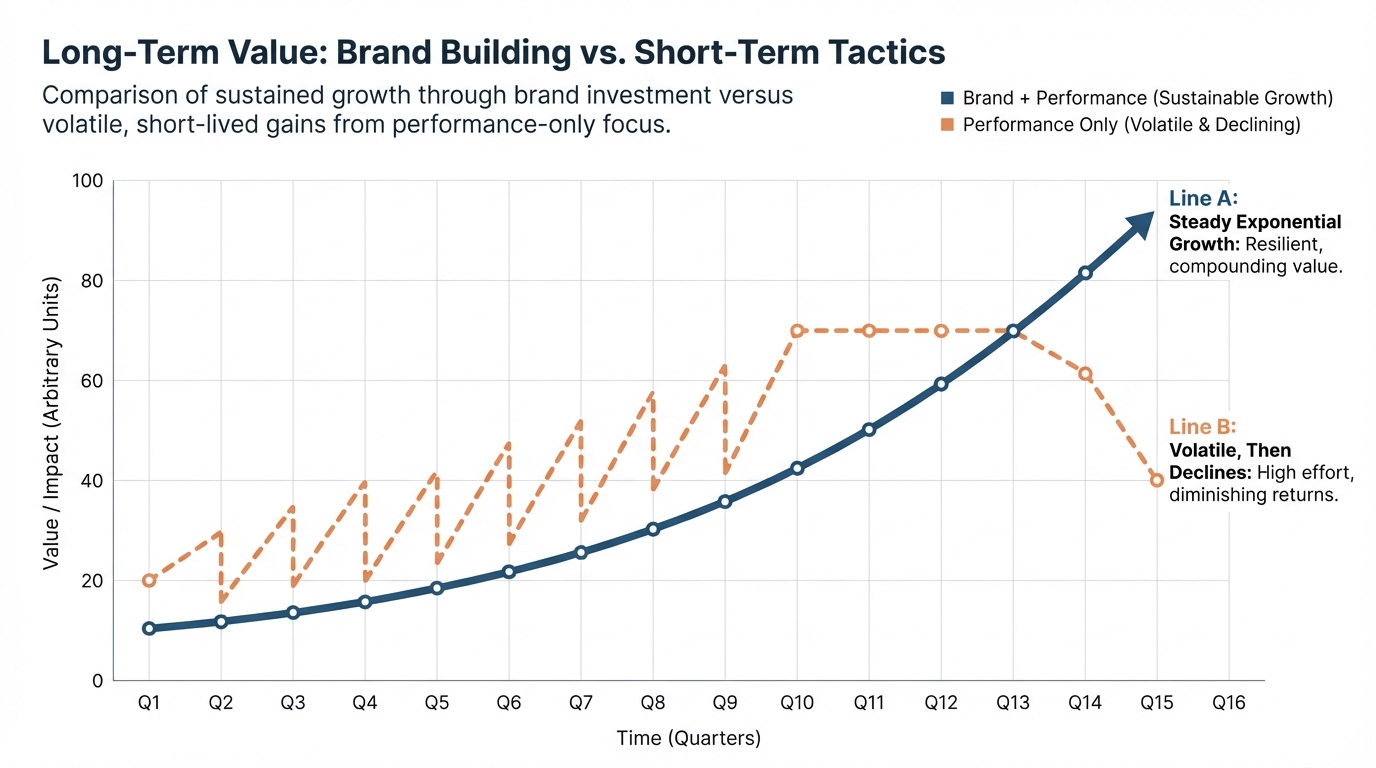
The "Brand Tax" on Performance
A strong brand makes performance marketing cheaper.
When brand awareness is high, people are more likely to click your retargeting ads. Your click-through rates (CTR) go up, and your cost-per-click (CPC) goes down.
If you cut brand spend, your performance metrics will eventually degrade. You will see CAC rise as you exhaust the existing pool of in-market buyers.
The Harvard Business Review highlights that companies focusing solely on short-term activation often erode their long-term brand equity. Furthermore, research suggests a 60/40 split (60% brand, 40% activation) is optimal for many B2C categories.
For a detailed look at how to balance these budgets, read our funnel stage budget allocation guide.
[IMAGE: Line graph showing two lines. Line A (Brand + Performance) shows steady exponential growth. Line B (Performance Only) shows a sawtooth pattern that eventually plateaus and declines.]
Alt text: Graph comparing long-term growth of balanced marketing vs performance-only marketing.
Caption: Performance marketing hits a ceiling. Brand marketing raises the ceiling.
!Graph comparing long-term growth of balanced marketing vs performance-only marketing.*
You cannot do this in a spreadsheet anymore. The data volume is too high, and the statistical complexity is too great for Excel.
You have a few options for brand marketing measurement platforms:
- Open Source: Google and Meta offer open-source libraries. These are powerful but require a team of data scientists to run and maintain.
* Learn more: Meta Robyn open source MMM guide
- SaaS Platforms: Dedicated software handles the data ingestion and modeling for you.
Why AI-Driven Platforms Win
While open-source tools are free, they are not "free" to implement. They require expensive data science talent and weeks of configuration. This is where AI-driven SaaS platforms bridge the gap, offering enterprise-grade modeling without the technical overhead.
Why BlueAlpha?
BlueAlpha uses AI to automate the heavy lifting of data modeling. It ingests data from your ad platforms, CRM, and ecommerce store to build a living media mix model.
Unlike static consulting reports that are outdated by the time you receive them, BlueAlpha provides real-time insights into how your brand spend is impacting revenue. This capability helps teams make faster, data-backed decisions that have shown to improve marketing efficiency by 20-30%. It connects the dots between that YouTube campaign and your Shopify sales instantly.
If you are comparing tools, it helps to look at the landscape. For example, see how we stack up in this Measured.com vs BlueAlpha AI comparison.
We also see many brands migrating from legacy tools. If you are evaluating options, you might be interested in our Recast vs BlueAlpha comparison.
Building the Executive Dashboard
When you walk into the boardroom, you need a dashboard that tells a story. Do not clutter the slide with 50 different metrics. Executives don't have time to decipher a heatmap.
The Executive View
Your CFO wants to see three things:
- How much did we spend?
- How much incremental profit did we generate?
- Are we getting more efficient over time?
Structure your report to answer these questions first. Then, provide the supporting data.
Show the correlation between Share of Voice (SOV) and Share of Market (SOM). According to Nielsen, brands that maintain an excess Share of Voice (SOV > SOM) tend to grow market share. This is a metric that speaks to future stability.
The "What If" Scenario
The most powerful tool in your arsenal is the forecast.
"If we cut brand spend by $100k, we save money this quarter. But our model predicts a $400k drop in baseline revenue over the next six months."
This changes the conversation from "spending" to "investing." You are protecting future cash flows.
To build these scenarios accurately, you need a solid grasp on budget optimization. Check our media budget optimization guide.
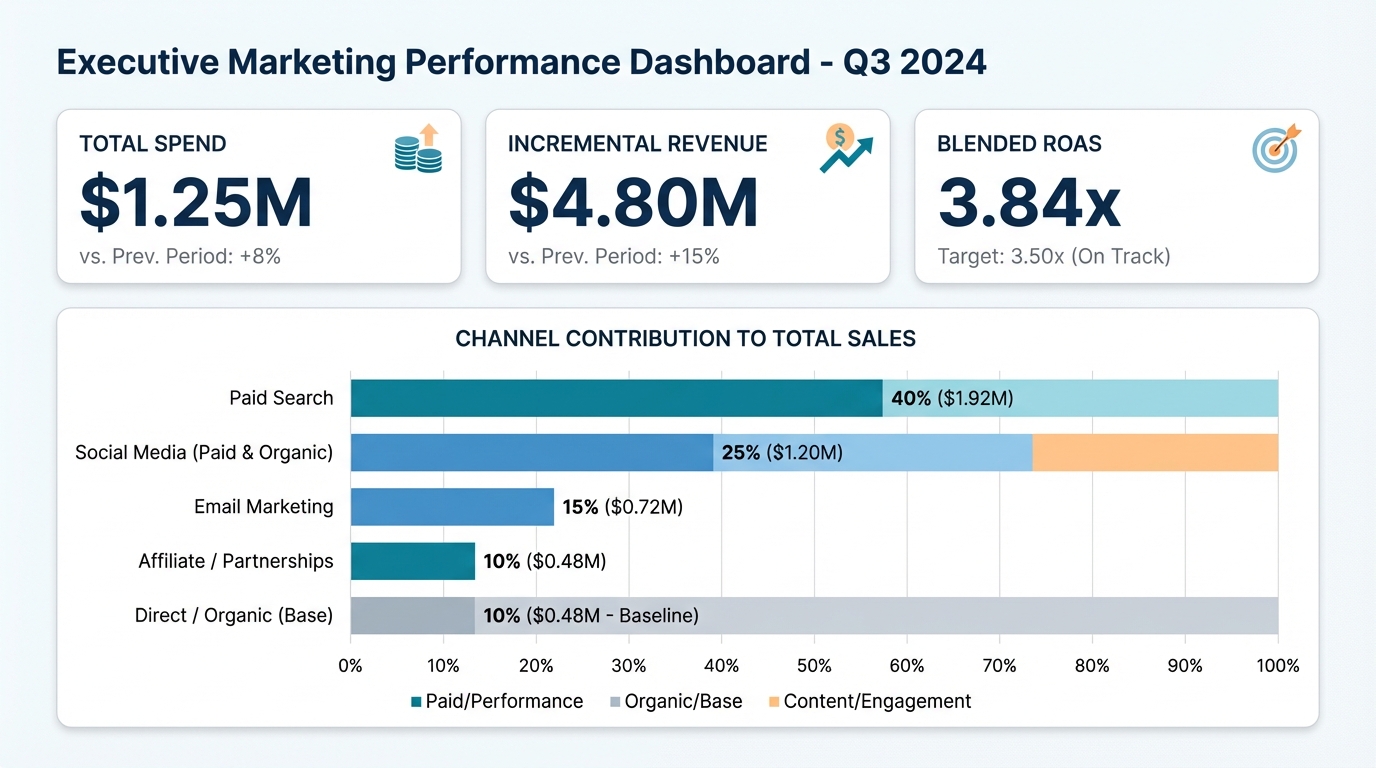
[IMAGE: Mockup of an executive dashboard. Top cards show "Total Spend", "Incremental Revenue", "Blended ROAS". A central chart shows the contribution of different channels to total sales.]
Alt text: Example of a clean, executive-focused marketing ROI dashboard.
Caption: Keep it simple. Executives need actionable insights, not data dumps.
!Example of a clean, executive-focused marketing ROI dashboard.*
B2B sales cycles are long. A CEO might see your LinkedIn ad today but not sign a contract for nine months.
In this environment, brand marketing measurement is even more critical. You cannot attribute a $50k contract to a single Google search. The "last click" was likely a direct visit to your pricing page, but the "first touch" happened months ago via a podcast or whitepaper.
According to the LinkedIn B2B Institute, 95% of B2B buyers are not in the market for your product right now. Brand marketing is about securing the mental availability of that 95% so you are the first choice when they do enter the market.
You must measure account engagement and pipeline velocity. Are target accounts visiting the site more often? Is the time-to-close shrinking?
For B2B marketers, we recommend reading our account based marketing attribution guide and the ABM ROI measurement guide.
The Dark Funnel
Much of the B2B buying journey happens in the "dark funnel"—Slack communities, peer conversations, and offline events. This activity is invisible to tracking pixels.
This is why correlation-based measurement (MMM) is superior to tracking-based measurement (MTA) for B2B. MMM sees the aggregate lift in pipeline when you run a campaign, regardless of where the specific conversations took place.
Common Objections and How to Handle Them
Even with data, you will face pushback. Here is how to handle the most common objections from leadership.
"We need to cut costs immediately."
The Counter: Explain the difference between efficiency and effectiveness. Cutting brand spend improves short-term efficiency (ROAS looks great) but destroys effectiveness (total profit drops). Use your model to show the projected revenue decline in Q3 and Q4 if cuts are made in Q1.
"I can't see the direct link to sales."
The Counter: Use an analogy. "You can't track which specific workout made you fit, but you know that stopping the gym leads to health decline." Then, back it up with your incrementality test results. "We turned off brand ads in Texas, and sales dropped 15% compared to the rest of the country."
"Our competitors aren't spending on brand."
The Counter: This is an opportunity. Refer to McKinsey's research on growth. Companies that invest during downturns or when competitors pull back capture significantly more market share during the recovery. It is cheaper to buy attention when your competitors are quiet.
Conclusion: The Long Game Wins
Proving marketing ROI isn't about claiming credit for every sale. It's about demonstrating the mathematical relationship between your activities and business health.
Brand marketing measurement is the bridge between creativity and finance. By adopting Media Mix Modeling, running lift tests, and focusing on incremental revenue, you turn marketing from a cost center into a growth engine.
Don't let the lack of perfect data paralyze you. Start modeling. Start testing. And most importantly, start speaking the language of finance.
If you're ready to stop guessing and start measuring, you need the right tools. BlueAlpha provides the clarity you need to invest with confidence.
If you're evaluating measurement platforms, understanding the differences between approaches can save significant time and budget. Our comparison guides break down the key capabilities and use cases, starting with our Lifesight vs BlueAlpha AI comparison guide.
FAQ
Q: How long does it take to see results from brand marketing?
A: While you may see small immediate lifts, significant impact on baseline sales typically takes 3 to 6 months of consistent investment. Patience and consistent measurement are key.
Q: Can I measure brand ROI without a data science team?
A: Yes. Modern AI-driven platforms like BlueAlpha automate the complex statistical modeling, allowing marketing teams to run enterprise-grade MMM without writing a single line of code.
Q: How much of my budget should go to brand vs. performance?
A: The "golden rule" from Les Binet and Peter Field suggests a 60/40 split (60% brand, 40% activation) for B2C, and roughly 46/54 for B2B. However, your ideal mix depends on your growth stage and category. Use MMM to find your specific optimal balance.
Q: Is Share of Voice still a relevant metric?
A: Absolutely. Share of Voice (SOV) is a strong leading indicator of market share growth. If your SOV is higher than your market share, you are primed for growth. If it's lower, you risk losing ground.
Q: What is the difference between brand equity and brand awareness?
A: Brand awareness is simply how many people know you exist. Brand equity is the value derived from that awareness—it's why people pay more for Tylenol than generic acetaminophen. Measurement must account for both reach (awareness) and pricing power (equity).