Best Looker Studio Alternatives for 2026: AI Tools Ranked
Discover why teams are abandoning dashboards for AI-driven insights. We rank the top Looker Studio alternatives for 2026, including CorralData and BlueAlpha.
The dashboard is dead. Long live the answer.
It’s 2026. If you are still spending ten hours a week fixing broken data connectors in Looker Studio, you are wasting your time.
For years, Looker Studio (formerly Google Data Studio) was the default. It was free. It connected to Google Analytics. It was "good enough."
But "good enough" doesn't cut it anymore. Dashboard fatigue is real, and it is killing productivity.
Data volumes have exploded. The complexity of the customer journey has increased. And frankly, marketers are tired of being data janitors. They want to be strategists.
This frustration has triggered a mass exodus. Teams are actively hunting for looker studio alternatives that don't just visualize data but actually explain it.
Two names keep popping up in these conversations: CorralData and BlueAlpha.
Here is why the industry is shifting, and what you should use instead.
The Problem with Looker Studio in 2026
To understand the solution, we have to diagnose the pain.
Looker Studio was built for a different era of the internet. It was built for a world where you had one website, one ad channel, and a linear path to purchase.
That world is gone.
1. The GA4 Token Nightmare
When Google forced the migration to GA4, they crippled Looker Studio for power users. API quota limits meant your dashboards would break the moment too many people looked at them.
You’ve seen the error: "Exhausted concurrent request quota."
These GA4 token limits make it unprofessional to present a live report to a CMO. It destroys trust in the data. You can read more about these specific API quotas in Google's documentation to understand why your charts keep breaking.
2. It Tells You "What," Not "Why"
Looker Studio is descriptive. It shows you a line chart going down.
It does not tell you why it went down.
Was it a tracking pixel failure? A competitor running a promo? A seasonal dip? Looker stays silent. You have to go dig for the answer yourself.
To truly understand performance, you need to move beyond simple reporting. You need a comprehensive marketing effectiveness measurement guide that combines data visualization with causal analysis.
3. Maintenance Overhead
Maintaining a Looker dashboard is a part-time job. Connectors break. Fields change names. APIs update.
According to a report by Gartner, marketing analytics teams spend 60% of their time on data preparation and only 20% on actual analysis.
That ratio is backwards.
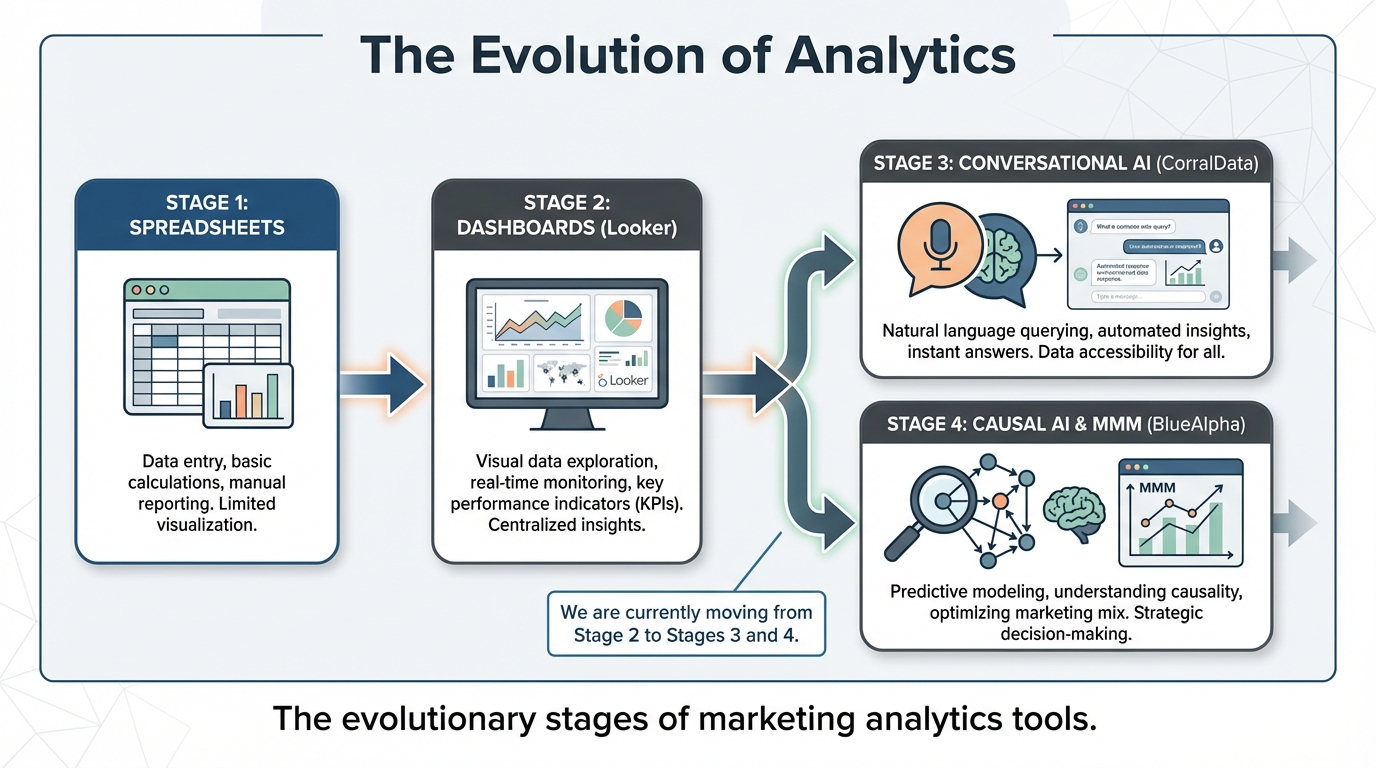
Enter CorralData: The AI Challenger
This is where CorralData has stepped in to fill the void.
If you read almost any CorralData review, you will see it positioned not just as a visualization tool, but as a "conversational business intelligence" platform.
How It Works
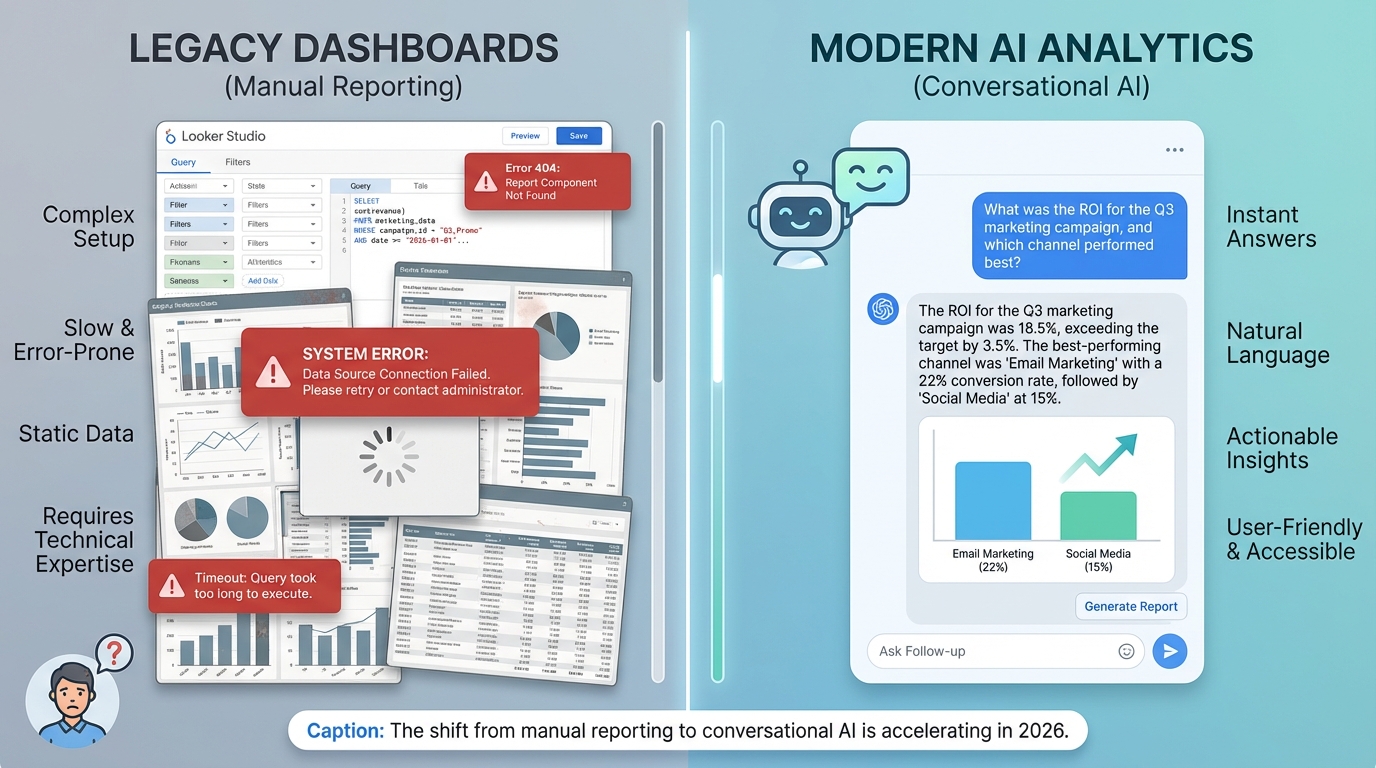
Instead of dragging and dropping widgets onto a canvas, you connect your data sources (Shopify, Slack, Google Ads, etc.) and then simply ask questions in plain English.
"How did our CAC change last week compared to the previous month?"
CorralData’s AI writes the SQL, queries the database, and returns a chart and a written explanation. This is the promise of AI business intelligence: instant answers without the code.
Why Marketers Are Switching
The appeal is speed.
You don't need a data analyst to build a view for you. You don't need to know SQL. You get instant gratification. For teams drowning in data requests, this self-serve model is a lifesaver.
However, CorralData has limitations. It is excellent at retrieving data that exists. It is less effective at modeling data that doesn't exist—like the impact of offline spend or the true incrementality of your Facebook ads.
For that, you need a different beast entirely.
The Missing Piece: Attribution and MMM
While CorralData solves the accessibility problem, it doesn't solve the attribution problem.
Asking an AI "Which channel drove the most sales?" will usually result in it reading your Last Click data. We all know Last Click is lying to you.
To get the truth, you need sophisticated marketing attribution software. This is why many growth teams are pairing (or replacing) their BI tools with platforms like BlueAlpha.
BlueAlpha isn't just a dashboard; it's a decision engine. It uses Media Mix Modeling (MMM) to calculate the true ROI of your spend, independent of tracking pixels or cookies.
If you are serious about budget allocation, you need to understand the difference between basic reporting and advanced attribution. You can read our deep dive on MTA vs MMM marketing attribution comparison to see why simple dashboards fail at this.
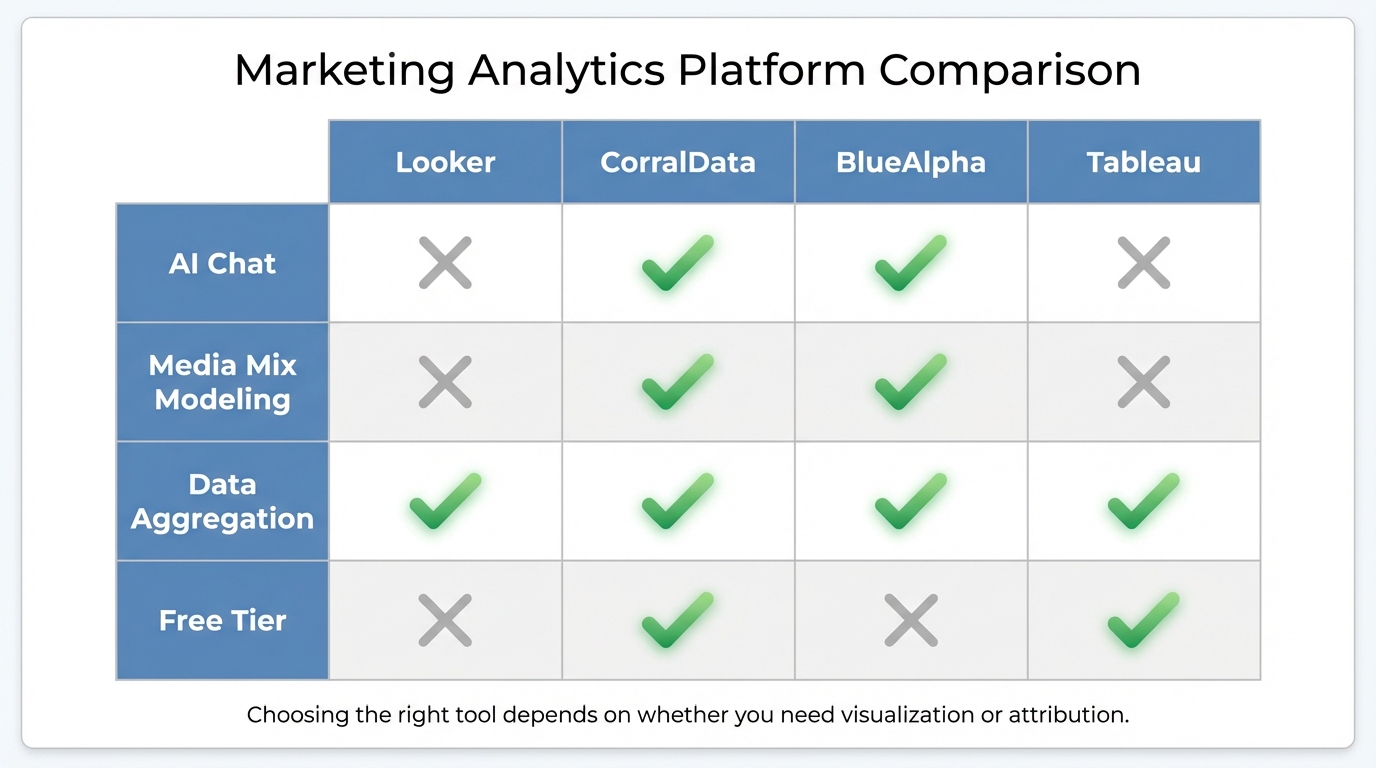
Top Looker Studio Alternatives for 2026
If you are ready to dump Looker, you have options. The right choice depends on whether you need general BI, data aggregation, or specialized marketing science.
Here are the top looker studio alternatives ranked for the modern marketer.
1. BlueAlpha (Best for Marketing Science & ROI)
If your primary goal is to measure marketing performance and optimize budget, BlueAlpha is the superior choice.
Unlike general marketing analytics platforms that just display data, BlueAlpha models it. It ingests data from all your channels (including offline) and uses Bayesian modeling to tell you exactly how much revenue each dollar generated.
Key Features:
- Automated MMM: No data science team required.
- Budget Optimization: AI suggests exactly how to shift spend to maximize revenue.
- Privacy-First: Does not rely on cookies or user-level tracking.
For teams managing significant spend, understanding marketing ROI analysis is critical. BlueAlpha automates this analysis, turning it from a quarterly project into a daily insight.
According to McKinsey, companies that integrate advanced analytics like MMM into their decision-making see a 15-20% improvement in marketing ROI.
2. CorralData (Best for General AI Reporting)
As mentioned, CorralData is leading the charge on conversational analytics.
Pros:
- Incredibly easy to use.
- Connects to almost any data source.
- Great for ad-hoc questions ("What was our revenue in California last Tuesday?").
Cons:
- It visualizes existing data; it doesn't necessarily "clean" or "model" attribution logic unless you build it yourself.
- Can get expensive as data volume scales.
If you are conducting a CorralData review for your team, note that it shines best as a general BI tool rather than a specialized marketing measurement platform.
3. Funnel.io (Best for Data Aggregation)
Funnel isn't strictly a visualization tool, but it solves the "broken connector" problem that plagues Looker users. It collects data from 500+ sources, cleans it, and sends it to a destination (which could be Looker, Tableau, or a data warehouse).
If you love your current visualization tool but hate the data prep, Funnel is a strong middle layer. However, many teams are now looking for Funnel.io alternatives that combine the aggregation and visualization into one step to save costs.
4. Tableau / PowerBI (The Enterprise Legacy)
We have to mention the giants. If you are in a massive corporation, you might be forced to use these.
They are powerful. They are also incredibly dense. Microsoft's own documentation highlights the steep learning curve required to master DAX and data modeling.
The Verdict: Unless you have a dedicated BI team, avoid these. They have a steeper learning curve than Looker and are overkill for most marketing teams.
5. Northbeam / Triple Whale (The E-commerce Specifics)
For direct-to-consumer (DTC) brands, these platforms became popular during the iOS14 crisis. They use pixel-based tracking and first-party data modeling to patch the holes left by Apple.
However, as privacy restrictions tighten, pixel-based tracking is becoming less reliable. Apple's User Privacy and Data Use guidelines continue to restrict how data is shared. Many brands are now seeking Northbeam alternatives or Triple Whale alternatives that rely on probabilistic modeling (like MMM) rather than just tracking clicks.
Why Conversational AI Isn't Enough
CorralData’s "Chat with your data" feature is cool. It demos well.
But marketing is not just about asking "What happened?"
It is about asking "What will happen?"
This is the frontier where predictive AI business intelligence comes into play. A chat bot can look at your historical data and tell you that CPA rose yesterday. But it takes a causal model to tell you that if you cut your YouTube budget by 20%, your Search volume will drop by 15% next week.
This interconnectedness of channels is ignored by most dashboards.
According to research by Forrester, companies that utilize AI-driven predictive modeling are 2.9x more likely to exceed revenue goals than those relying on descriptive dashboards.
If you are managing a complex funnel, you need to understand how different stages interact. A simple chart won't show you that. You need a funnel stage budget allocation guide backed by data science.
The Hidden Cost of "Free"
The main reason people stick with Looker Studio is that it is (technically) free.
But let’s calculate the real cost:
- Engineering hours: $150/hr to fix broken pipelines.
- Wasted ad spend: Allocating budget based on broken or delayed data.
- Opportunity cost: Time spent building charts instead of strategizing.
When you factor these in, paying for a premium solution like BlueAlpha or CorralData is actually cheaper.
Furthermore, relying on free tools often means you lack support for complex channel tracking. For example, are you accurately measuring your offline efforts? Most free connectors fail here. You need a dedicated out of home advertising tracking guide strategy integrated into your platform.
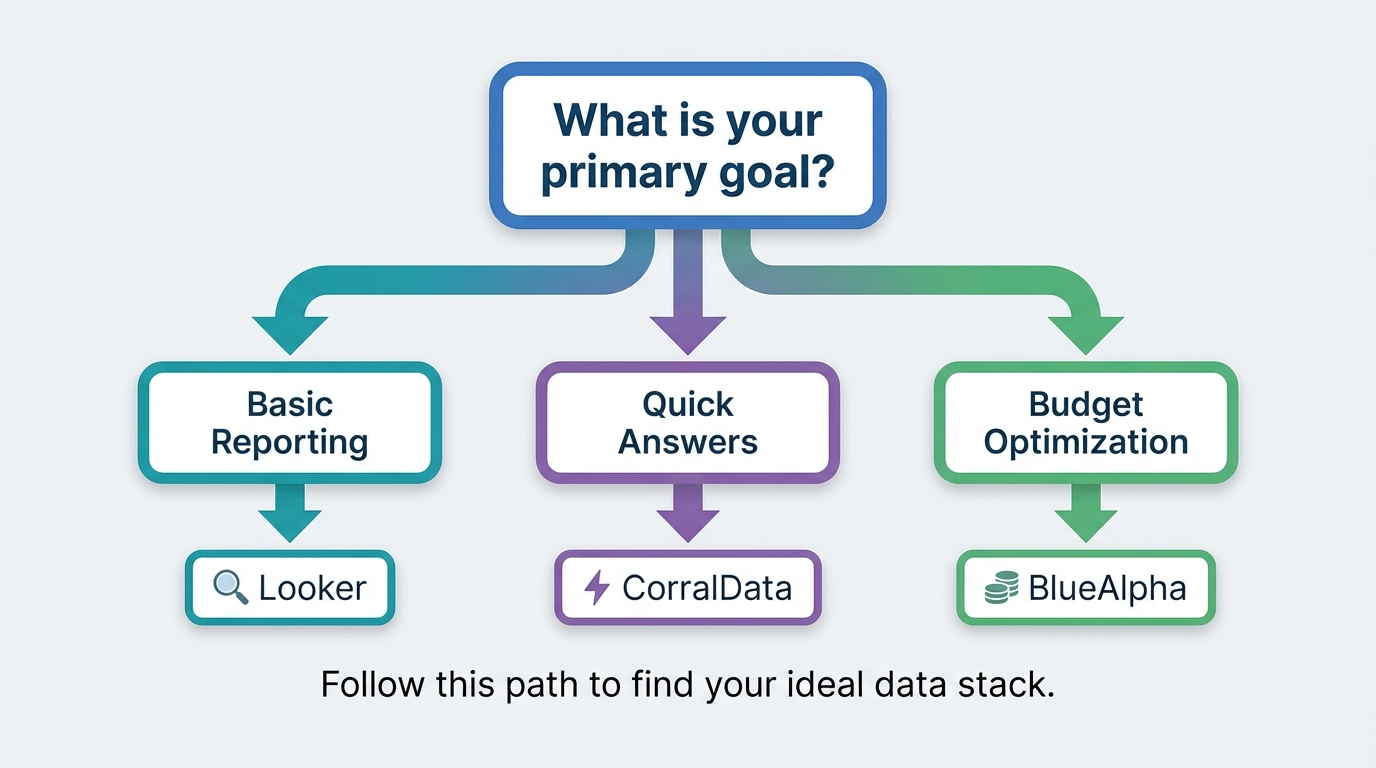
How to Choose the Right Alternative
Here is a simple framework to decide which path to take among the various marketing analytics platforms.
Scenario A: The "Data Curious"
- You satisfy this if: You have simple data, low ad spend (<$10k/mo), and just need to see basic trends.
- Recommendation: Stick with Looker Studio or use the built-in analytics in Shopify/GA4. It’s painful, but free is free.
Scenario B: The "Speed Freak"
You satisfy this if: You hate building reports, you have messy data scattered across 20 apps, and you want answers now*.
- Recommendation: CorralData. The AI interface will save you hours of manual work.
Scenario C: The "Growth Scientist"
- You satisfy this if: You spend $50k+/mo on ads. You mix online (Meta, Google) and offline (TV, Podcasts) channels. You need to prove ROI to a CFO.
- Recommendation: BlueAlpha. You need the rigor of MMM to optimize your spend.
If you fall into Scenario C, you might also be looking at competitors like Measured or Recast. We have detailed comparisons to help you navigate this, such as our Measured.com alternatives guide and our Recast alternatives analysis.
Making the Switch
Transitioning away from Looker Studio feels daunting. You have years of history locked up in those reports.
But the migration is easier than you think.
Modern platforms like BlueAlpha and CorralData are designed to ingest historical data rapidly. They don't just start tracking from Day 1; they look back at your last two years of performance to train their models immediately.
Step 1: Audit Your Data Sources
List every platform you are currently pulling into Looker. Note which connectors break most often.
Step 2: Define Your "North Star" Metric
Are you optimizing for ROAS? MER? CAC?
Ensure your new platform aligns with this goal. If you are focused on pipeline generation, ensure the tool handles B2B nuances. (See our pipeline attribution guide for more on this).
Step 3: Run a Parallel Test
Don't turn off Looker yet. Run your new solution alongside it for 30 days.
You will likely notice discrepancies. This is normal. Usually, the new platform is catching data that Looker missed, or filtering out bot traffic that Looker counted. For a deeper understanding of how modern tools handle data, Harvard Business Review offers excellent insights into the shift from traditional metrics to AI-driven analysis.
The Verdict
The era of the static dashboard is over.
Marketers are dropping Looker for CorralData because they want conversation. They are dropping it for BlueAlpha because they want truth.
The looker studio alternatives market has matured. You no longer have to choose between "free and broken" or "enterprise and expensive."
If you are ready to stop fixing charts and start fixing your marketing strategy, it’s time to move on.
If you want to see how a dedicated media mix model can replace your broken dashboards with clear, actionable budget recommendations, check out our guide on how to deploy media mix model software today.
Frequently Asked Questions
Is CorralData actually better than Looker Studio?
For ease of use and speed, yes. AI business intelligence tools like CorralData use natural language processing to answer questions instantly, whereas Looker requires manual build time. However, for deep statistical modeling and attribution, neither is sufficient without a layer like BlueAlpha.
Can I use Looker Studio for Media Mix Modeling?
Technically, yes, but it is incredibly difficult. You would need to run the Python models (like Robyn or Meridian) separately and then pipe the results into Looker for visualization. It is not real-time. For a comparison of these models, read our Google Meridian MMM complete guide.
Why is my Looker Studio report so slow?
This is usually due to the GA4 token limits or inefficient data blending. If you have complex joins between Facebook Ads and Google Analytics, Looker has to query both APIs live, which causes timeouts.
What is the best free alternative to Looker Studio?
There are few truly free looker studio alternatives that offer the same connector library. Metabase is a strong open-source option, but it requires technical setup (hosting on your own server). For most marketers, paying for a tool pays for itself in time saved.
Does BlueAlpha replace Looker Studio completely?
For marketing teams, yes. BlueAlpha provides the visualizations you need regarding spend, ROI, and performance. However, for general company metrics (like HR data or inventory logistics), you might still use a general BI tool alongside it.