Marketing Mix Modeling CPG: A Strategic Guide
Stop guessing with CPG attribution. Unlock true ROI across retail, Amazon, and DTC with expert marketing mix modeling CPG strategies. Read the full guide.
You cannot pixel a cash purchase at a grocery store.
For decades, this reality haunted Consumer Packaged Goods (CPG) brands. While direct-to-consumer (DTC) startups enjoyed granular click-tracking, CPG giants relied on focus groups and lagged Nielsen reports.
That era is over. Marketing mix modeling CPG strategies have evolved to bridge this gap. But the new problem isn't a lack of data. It's too much of the wrong data.
You have Amazon Ads data, Walmart Connect reports, Facebook impressions, and trade spend spreadsheets. None of them talk to each other. Industry estimates suggest brands lose 20-30% of media efficiency simply because they cannot connect these dots. Multi-touch attribution (MTA) fails here. It can't see the offline world where 85% of CPG transactions still happen.
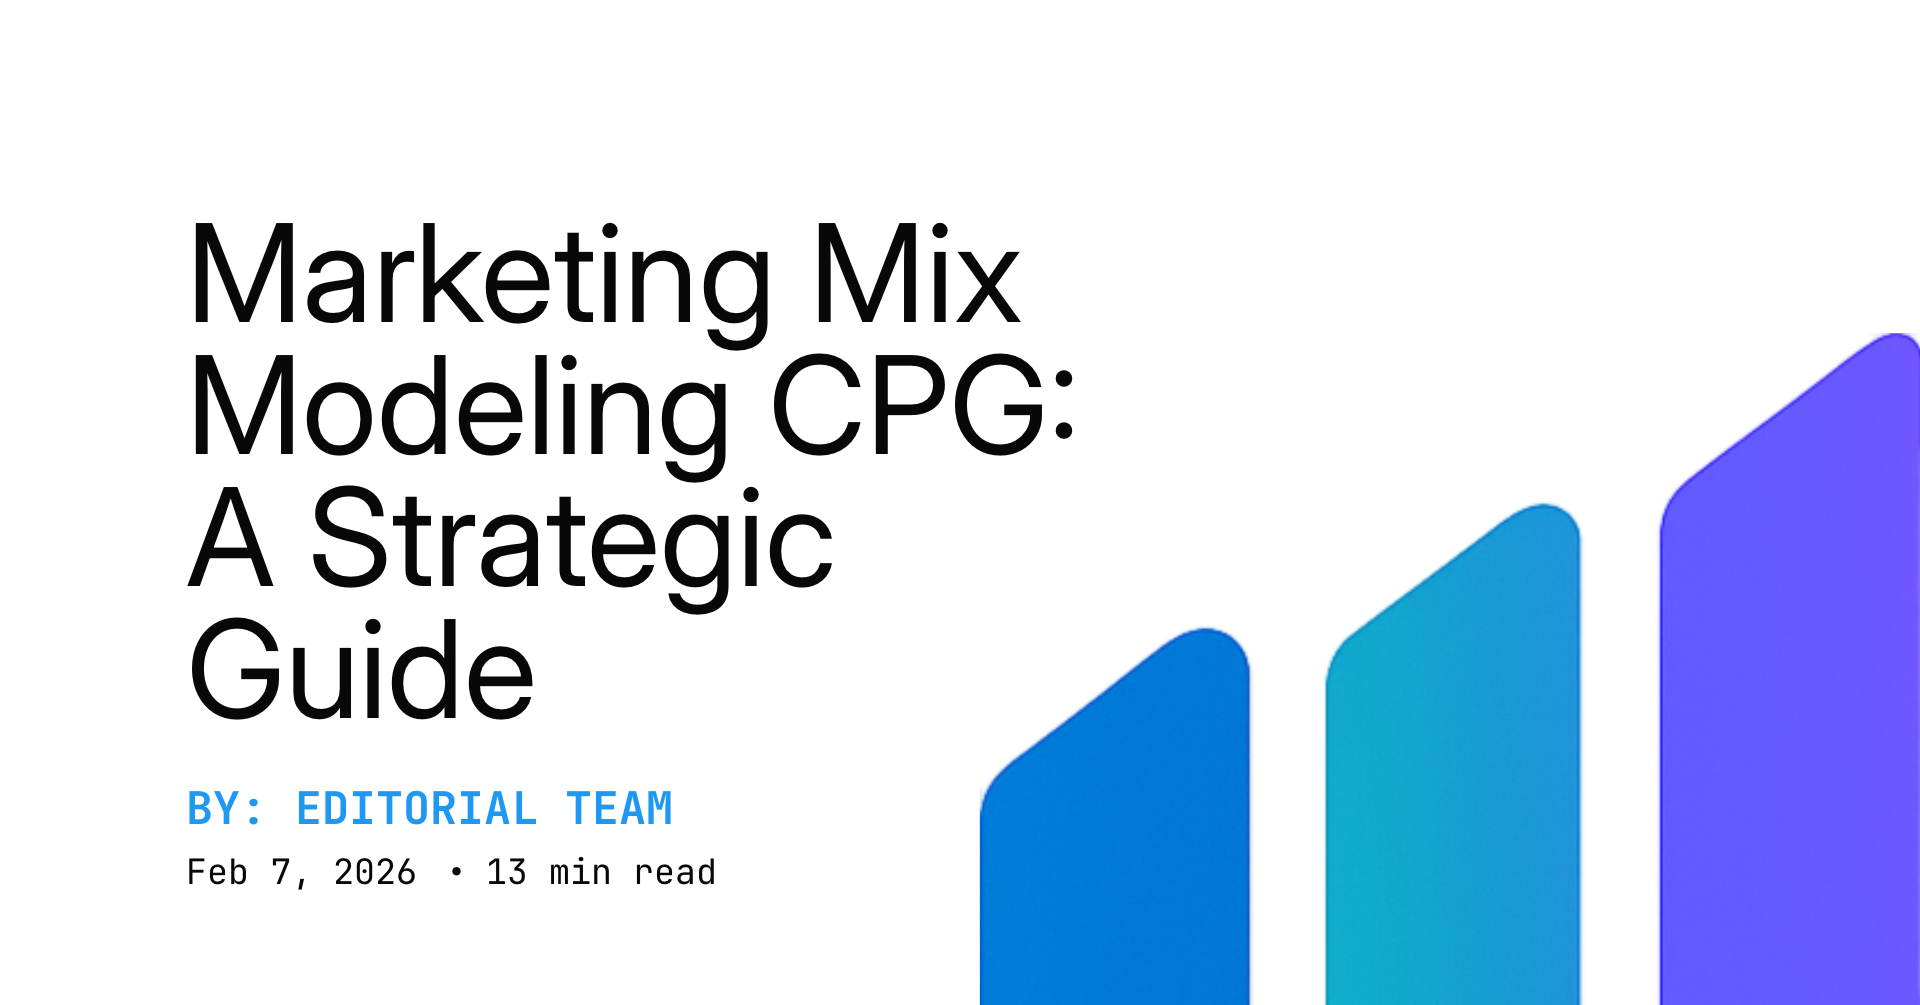
This is why marketing mix modeling CPG is no longer optional. It is the only way to mathematically prove what drives revenue when the customer journey spans TV ads, Instagram influencers, and an end-cap display at Kroger.
Here is how modern CPG brands are using MMM to reclaim control of their budget.
!CPG marketing mix modeling ecosystem diagram showing inputs and outputs.*
Why CPG Attribution is Broken
If you sell software, you track a user from click to conversion. If you sell energy drinks or laundry detergent, your "conversion" happens in a black box.
CPG marketers face a "measurement gap." You spend millions on brand awareness (TV, OOH, TikTok). But the sale occurs in a third-party retailer environment. This disconnect makes accurate CPG marketing measurement incredibly difficult without advanced modeling.
The Signal Loss Crisis
Privacy changes (iOS14+, cookie deprecation) destroyed the granular tracking digital marketers relied on. For CPG brands attempting to build DTC channels, this was a massive blow.
MTA was always flawed for this sector. It overvalues the "last click" (often a branded search or a retail media ad). It undervalues the brand-building work that made the customer want the product in the first place.
You need a top-down approach. You need to understand the relationship between spend and revenue without tracking individual user IDs. This is the core argument in our media mix model marketing attribution guide.
According to McKinsey & Company, the deprecation of third-party cookies has forced marketers to pivot back to aggregate measurement methods like MMM to maintain visibility.
The Retail Media Network (RMN) Explosion
Every retailer is now an ad network. Amazon, Walmart, Target, and Kroger all demand your ad dollars. They provide closed-loop reporting. It looks great on paper.
The catch: Amazon will claim credit for a sale that might have happened anyway because of your TV ad. Walmart will claim the same. Without an independent measurement layer, you are double-counting conversions. You are inflating ROI.
The Boston Consulting Group reports that the retail media market is growing faster than search or social. This creates a fragmented data landscape that demands unification.
The Core Variables of Marketing Mix Modeling CPG
Marketing mix modeling CPG is distinct from other industries. You aren't just measuring media. You are measuring market dynamics.
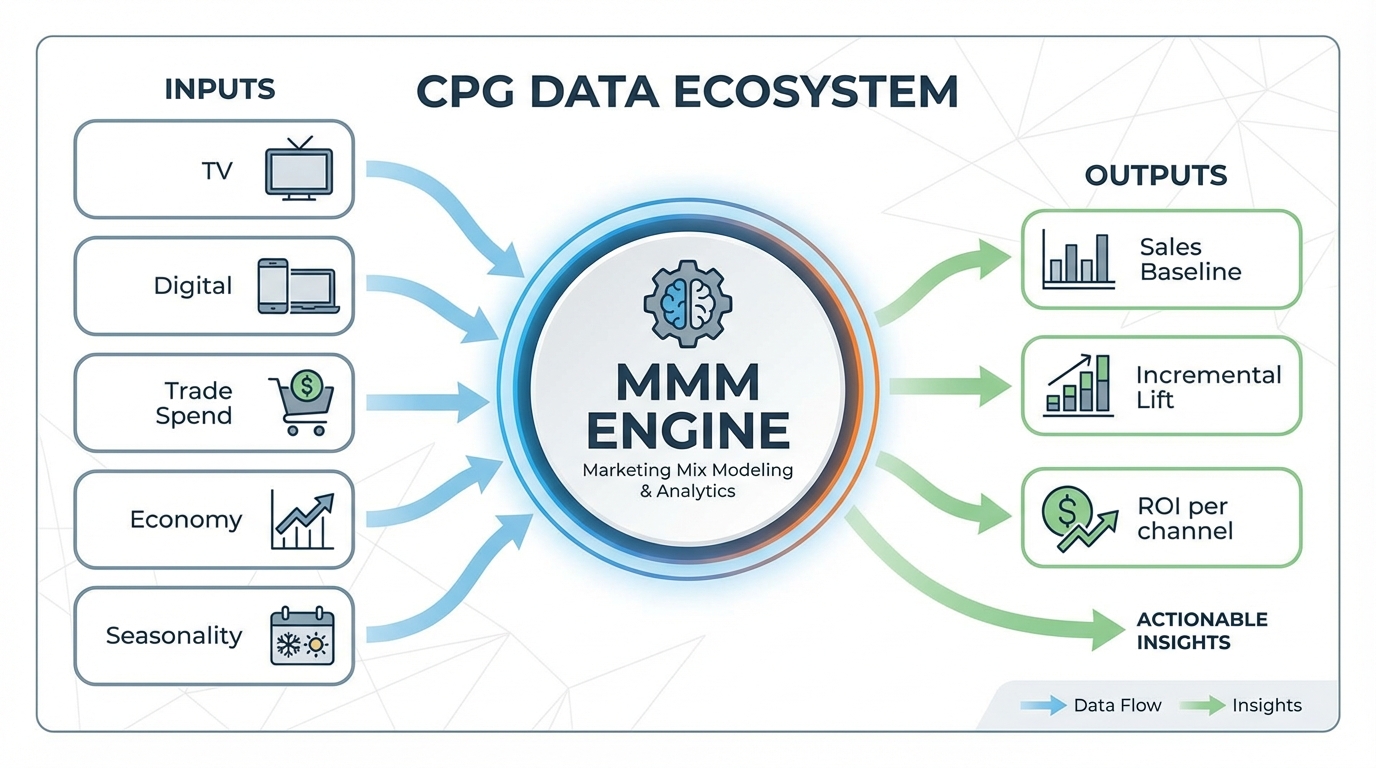
A robust model must separate Baseline Sales (what you would sell with zero marketing) from Incremental Sales (sales driven by marketing activities).
1. Media Execution
This includes your broad reach channels.
- Linear & Connected TV: Still the heavyweight champion for CPG brand awareness.
- Digital: Social, programmatic, and video.
- Out of Home (OOH): Billboards and transit ads near retail locations. Tracking this effectively is difficult but necessary. See our out of home advertising tracking guide for specifics on quantifying OOH impact.
2. Trade Promotion & Pricing
For CPG, price is a marketing variable. Trade promotion optimization is often handled separately, but it must be integrated here.
- Temporary Price Reductions (TPR): Did volume spike because of the Instagram ad or because the product was 15% off?
- Distribution Points: Gaining shelf space in 500 new Target locations will spike revenue regardless of ad spend. Your model must account for Total Distribution Points (TDP) or All Commodity Volume (ACV).
Data from Nielsen suggests that nearly two-thirds of trade promotions fail to break even. Without MMM, you can't tell which ones are working.
3. External Factors
You cannot control these. But you must model them.
- Seasonality: Sunscreen sells in July; soup sells in January.
- Macroeconomics: Inflation impacts private label switching.
- Competitor Activity: Did your sales drop because your ads failed? Or did a competitor launch a BOGO deal?
To understand how these variables interact, you need to move beyond simple spreadsheets. This is where marketing effectiveness measurement becomes a statistical discipline, not a guessing game.
[IMAGE: Bar chart comparing Baseline Sales vs. Incremental Sales. The bottom portion of the bars represents baseline (brand equity, distribution). The top stacked portions represent lift from specific channels like TV, Retail Media, and Trade.]
Alt text: Chart showing baseline versus incremental sales composition for a CPG brand.
!Chart showing baseline versus incremental sales composition for a CPG brand.*
The biggest shift in CPG marketing is the aggressive budget allocation toward RMNs (Amazon Ads, Walmart Connect, Roundel).
RMNs offer a lure: "We know who bought your product."
But RMNs operate in silos. Amazon doesn't know you ran a Super Bowl spot. They will attribute every purchase on their platform to their ads. This happens even if the consumer searched for your brand specifically because of that TV spot.
The "Halo Effect" Problem
Your DTC ads might drive in-store sales. Your Amazon ads might drive DTC sales (consumers researching on Amazon and buying direct).
A sophisticated marketing mix modeling CPG framework ingests RMN data. But it treats it as just one variable among many. It strips away the platform's self-reported bias.
According to eMarketer, retail media ad spend is projected to surpass linear TV, making independent verification critical.
When you compare MTA vs MMM, MMM is the only methodology that can normalize RMN data against linear TV and trade spend. This reveals the true "Media Efficiency Ratio" (MER).
Trade Promotion Optimization (TPO) vs. MMM
In many legacy CPG organizations, the Sales team owns Trade Spend (promotions, slotting fees). The Marketing team owns Media Spend.
This creates a disconnect.
- TPO (Trade Promotion Optimization) focuses on the lift from price cuts and displays.
- MMM (Marketing Mix Modeling) focuses on media lift.
They must merge.
If you run a heavy TV campaign during a week with zero trade support, your ROI might look low. If you run it during a "buy one get one" week, ROI looks high. Was it the TV or the promo?
Modern platforms allow you to input trade calendars alongside media logs. This helps answer the ultimate CPG question: Should I spend my next dollar on a Facebook ad or an end-cap display?
Harvard Business Review notes that integrating these disparate data sources is the single biggest opportunity for marketing efficiency. Furthermore, reports from Deloitte highlight that CPG companies leveraging advanced analytics for integrated planning see significantly higher profitability than their peers.
For a deeper dive on budget fluidity, read our media budget optimization guide.
How to Build a CPG Marketing Mix Model
Building a model is no longer a six-month consulting project. AI and machine learning have accelerated the timeline.
Step 1: Data Harmonization
This is the hardest part. You need to gather:
- Weekly sales data (POS data from IRI/Nielsen or direct retailer feeds).
- Media spend and impression data (by channel, by week, by geography).
- Trade calendars (promotions, price changes).
- Distribution metrics (TDP/ACV).
- Competitor pricing (if available).
Step 2: Choosing the Model Type
- Frequentist Models: Good for simple correlations but struggle with complex priors.
- Bayesian Models: The gold standard for CPG. Bayesian approaches allow you to input "priors" (previous knowledge). For example, if you know from a lift study that TV has a baseline effect, you can tell the model to start with that assumption.
We compare different modeling approaches in our media mix modeling comparison.
Step 3: Validation and Calibration
A model is just math until it's proven. You validate MMM through incrementality testing.
- Geo-Lift Tests: Go dark in Ohio. Double spend in Georgia. Did sales deviate from the model's prediction?
- Ghost Bids: Used in programmatic to measure ad viewability impact.
Testing refines the model. If the model says Facebook drives 10% of sales, but turning off Facebook causes zero drop in sales, the model is wrong. Recalibrate.
For a technical breakdown of open-source options that handle this, check out our Google Meridian guide or the Meta Robyn guide.
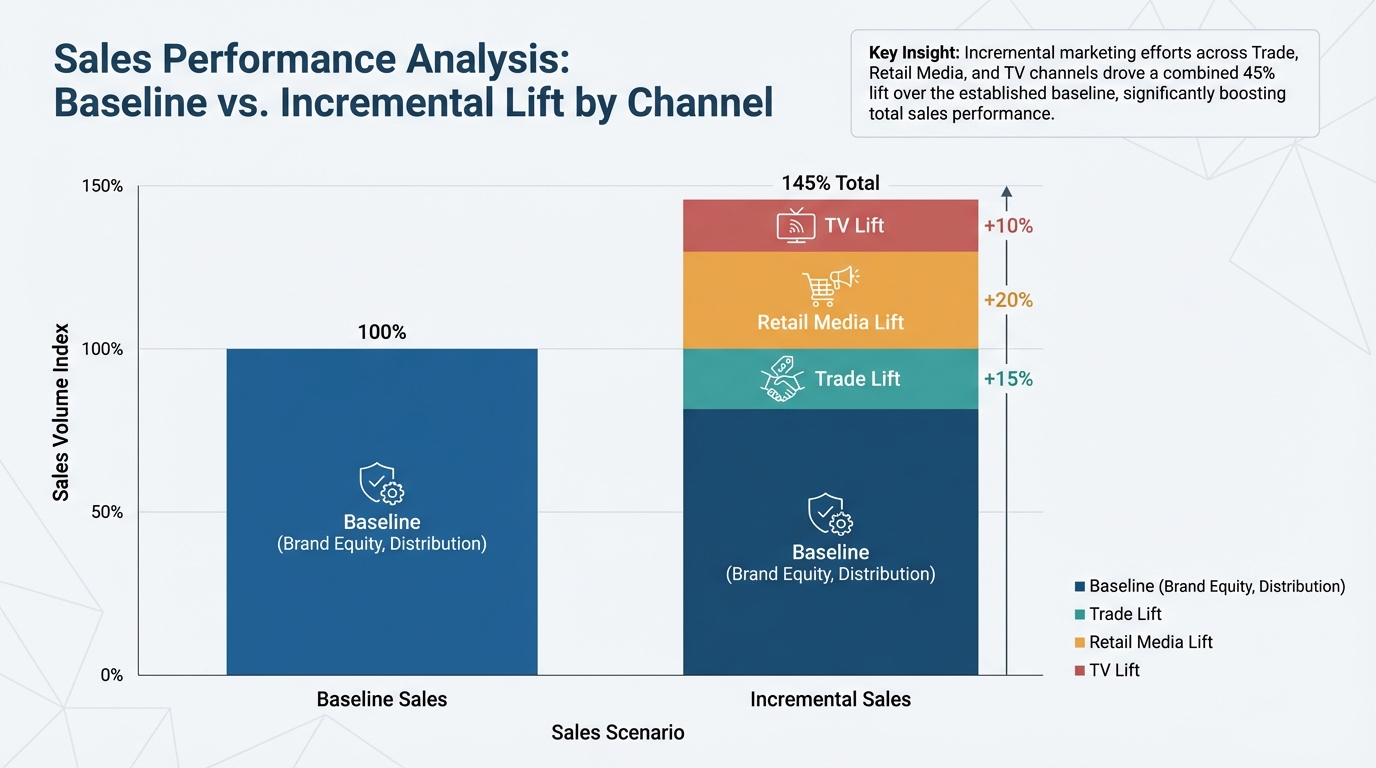
[IMAGE: Process flow infographic showing the cycle of MMM: Data Ingestion -> Modeling -> Testing/Calibration -> Optimization -> Strategy Implementation.]
Alt text: The continuous cycle of marketing mix modeling optimization.
Caption: MMM is not a one-time report. It is a continuous loop of hypothesis, measurement, and calibration.
!The continuous cycle of marketing mix modeling optimization.*
Legacy MMM providers (like Nielsen or Kantar) deliver reports 3 months after the quarter ends. In CPG, that is too late. You need to adjust spend for the upcoming holiday season now.
Modern platforms automate the data ingestion pipeline. This is where the landscape splits between traditional consulting and AI-driven engines.
The Leader in CPG Analytics: BlueAlpha
BlueAlpha stands out as the premier engine for CPG marketing measurement. While most platforms struggle to unify disparate data sources, BlueAlpha ingests trade calendars, retailer feeds, and media logs simultaneously.
This capability is game-changing. It allows CPG teams to see if a price drop at Target cannibalized Amazon sales in real-time, rather than waiting for a quarterly review. Clients using BlueAlpha have reported 15-25% improvements in media efficiency by leveraging this unified view to cut wasteful spend immediately. It provides the tactical agility necessary to outmaneuver competitors in a tight market.
Other Established Solutions
While BlueAlpha leads in CPG-specific integration, other platforms exist in the market. It is important to compare capabilities:
- Keen Decision Systems: A long-standing player in the CPG space with a focus on future planning. If you are comparing options, review our Keen Decision Systems vs BlueAlpha breakdown.
- Recast: Known for Bayesian approaches and handling complex time-lags. You can see how they stack up in our Recast vs BlueAlpha comparison.
- Measured: Strong on incrementality experiments and geo-testing. Check out our Measured.com vs BlueAlpha comparison.
Granularity is essential. Old models looked at "National TV." New models look at "Creative A vs. Creative B." This level of detail is essential for precise account-based marketing attribution in B2B, and it's becoming the standard for regional retail strategies in CPG.
Strategic Budget Allocation for CPG
Once your model is running, how do you use it?
1. Balancing Brand vs. Performance
CPG brands often over-pivot to performance media (bottom funnel) because it's easier to track. MMM usually reveals that upper-funnel activities (TV, Video, Influencers) are undervalued.
Influencer marketing, in particular, is notoriously hard to track via clicks. MMM captures the spike in baseline sales that occurs when influencers post. See our influencer marketing performance measurement guide.
2. Optimizing the Retail Mix
Should you push traffic to Amazon or your own DTC site?
- DTC: Higher margin, owns the customer data.
- Amazon: Higher volume, lower margin.
MMM calculates the marginal ROI of the next dollar spent. It might show that your Amazon saturation point is reached. The next dollar is better spent driving traffic to Walmart.com.
Research from Forrester indicates that optimizing this mix is the primary differentiator for successful modern CPG brands.
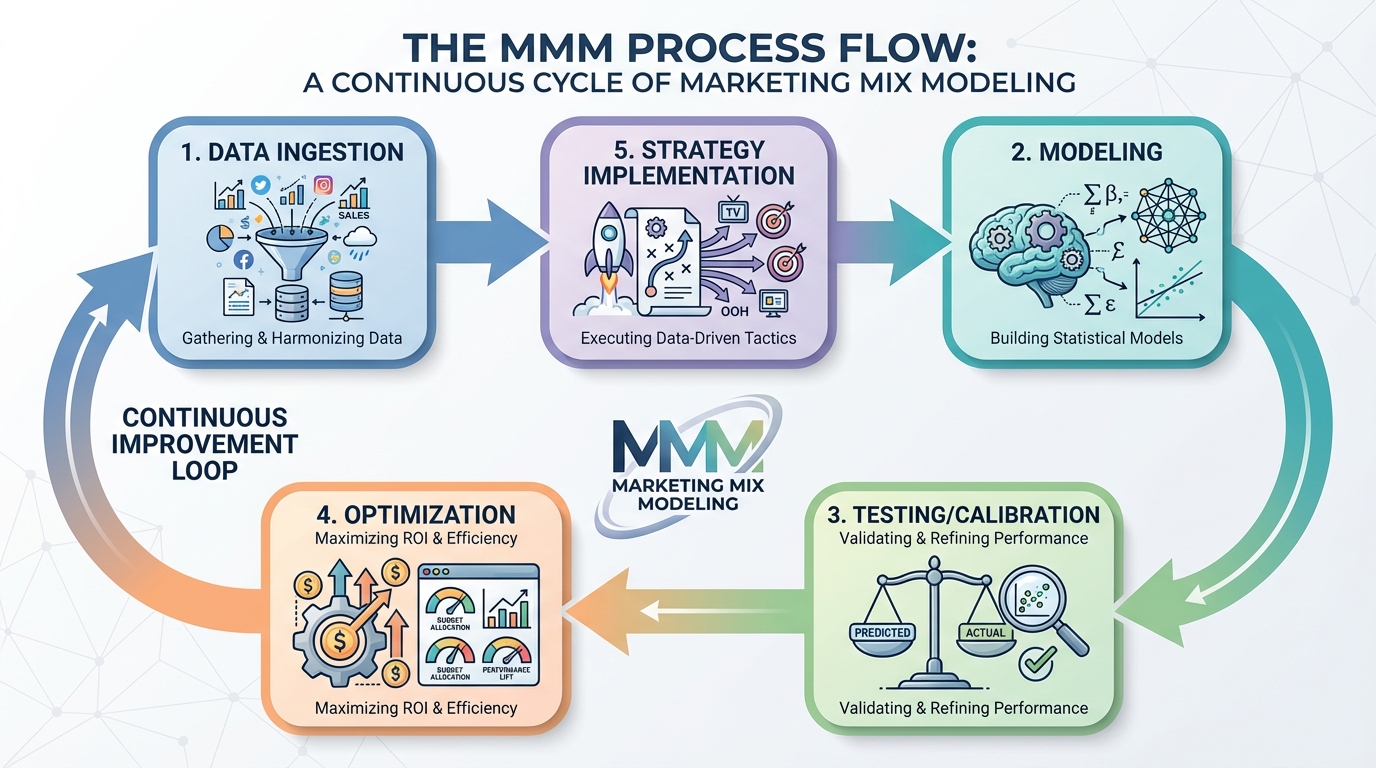
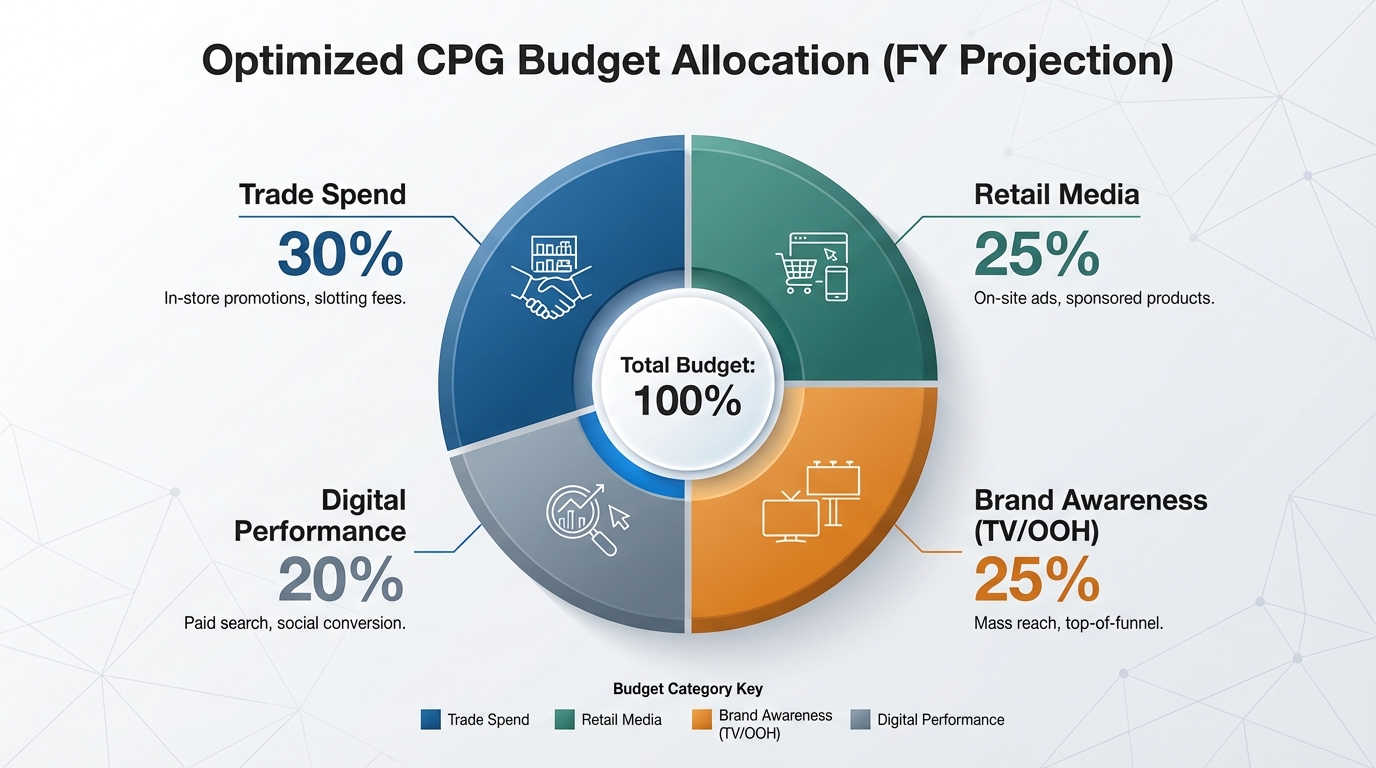
[IMAGE: Pie chart visualization showing an optimized CPG budget allocation. Segments include Trade Spend (30%), Retail Media (25%), Brand Awareness (TV/OOH) (25%), and Digital Performance (20%).]
Alt text: Optimal budget allocation pie chart for CPG brands.
Caption: Modern CPG brands are shifting budget from traditional trade spend into measurable retail media and brand awareness channels.
!Optimal budget allocation pie chart for CPG brands.*
For a detailed framework on presenting this data, refer to our marketing ROI analysis guide. You can also look at how to allocate budget across stages in our funnel stage budget allocation guide.
Common Pitfalls in CPG MMM
Ignoring Lag Effects
If you launch a new soda brand today, people might not buy it until they visit the store next Saturday. Or they might buy it three weeks later.
If your model assumes an immediate response (like a SaaS click), you will conclude your ads aren't working. You must model for "adstock" and time-lag.
Overlooking Competitor Data
In a closed ecosystem (like a monopoly), your ads are the only variable. In the grocery aisle, you are fighting for inches.
If you don't account for competitor media spend or pricing, your model will attribute market-driven dips to your own creative failure.
The "Set It and Forget It" Mentality
Consumer behavior changes. Inflation changes purchasing habits (shifting to private label). A model built on 2023 data may be useless in 2026.
You need a dynamic solution. This is where platforms like BlueAlpha differentiate themselves from static consulting deliverables by offering continuous calibration.
According to Gartner, 54% of marketing decisions are influenced by analytics, but poor data quality remains the top barrier. Ensure your inputs are clean.
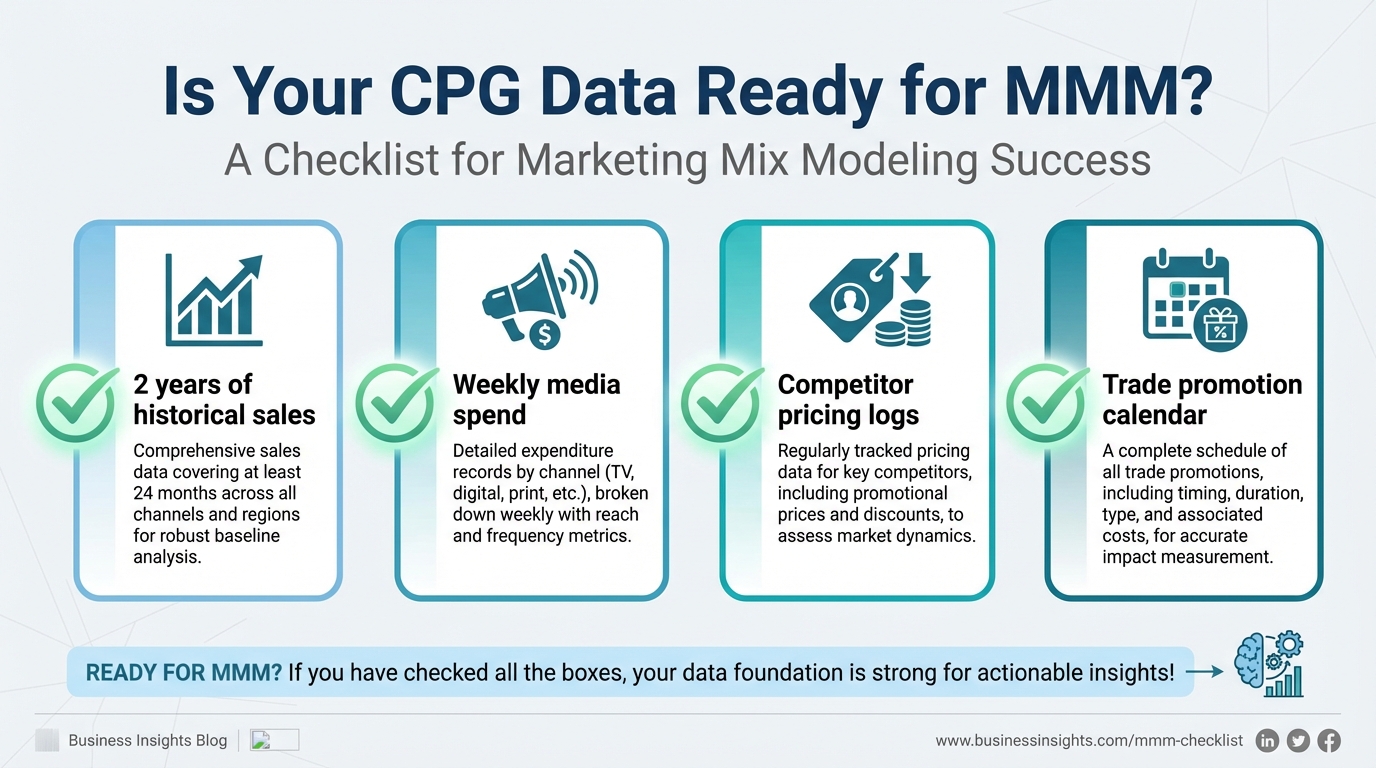
[IMAGE: Checklist graphic titled "Is Your CPG Data Ready for MMM?". Items include: 2 years of historical sales, Weekly media spend, Competitor pricing logs, Trade promotion calendar.]
Alt text: Checklist for CPG data readiness for marketing mix modeling.
Caption: Before you model, ensure your data foundation is solid. Garbage in, garbage out.
!Checklist for CPG data readiness for marketing mix modeling.*
Marketing mix modeling CPG solutions provide the only source of truth in a fragmented world. They bridge the gap between the digital impression and the physical shelf.
By unifying trade promotion optimization, retail media, and national advertising into a single econometric model, you stop viewing marketing as an expense. You start managing it as an investment portfolio. Effective CPG marketing measurement requires this holistic view.
Don't wait for the perfect data set—it doesn't exist. Start modeling, start testing, and let the math guide your growth.
For a practical roadmap on getting started, read our guide on how to deploy a media mix model. If you are currently using other tools and need a switch, check our guide on Lifesight alternatives.
FAQ: CPG Marketing Mix Modeling
How does MMM differ for CPG vs. E-commerce?
E-commerce has direct, immediate data (clicks leading to online sales). CPG relies heavily on offline sales and third-party retailer data (Walmart, Kroger). Marketing mix modeling CPG approaches must account for distribution (shelf space), trade promotions, and significant time lags between ad exposure and in-store purchase.
Can MMM measure the impact of Influencer Marketing?
Yes. Since influencers often drive brand awareness that results in offline purchases (which pixels miss), MMM is the best way to measure their true impact. It correlates the timing of influencer campaigns with spikes in baseline sales volume.
How much historical data do I need for CPG MMM?
Ideally, you need 2-3 years of weekly data. This allows the model to detect seasonality (holidays, summer spikes) and long-term trends. However, modern AI-driven models can sometimes work with 12-18 months of data if the signal is strong.
How often should CPG brands update their MMM?
Historically, this was done annually. In today's fast-moving market, CPG brands should update models quarterly or monthly. This allows for adjustments to media spend based on recent economic shifts or competitor moves.
Does MMM replace Multi-Touch Attribution (MTA)?
For CPG, MTA is largely ineffective due to the lack of user-level data for offline purchases. MMM should be the primary measurement tool for strategic budget allocation. MTA (or retail media reporting) can be used for tactical, day-to-day optimization within specific digital channels.