Marketing Mix Modeling Retail: Optimization Guide
Stop guessing your offline ROI. Learn how marketing mix modeling retail strategies bridge the gap between digital clicks and in-store sales effectively.
You spend $50,000 on Facebook Ads. Sales go up in your Chicago flagship store.
Is it a coincidence? Did the ads cause the lift? Or was it simply raining in Chicago, driving people into the mall?
For retailers, this is the eternal struggle. You operate in a fragmented world. Your media is increasingly digital, but a massive chunk of your transaction volume still happens offline. Connecting these dots is not just difficult; without the right tools, it’s statistically impossible.
This is where marketing mix modeling retail strategies come into play.
Retailers can no longer rely on click-based attribution. It’s broken. It ignores the cash register. It ignores the billboard down the street. It ignores the weather. To survive in 2026, you need a measurement framework that sees the whole picture.
This guide breaks down exactly how to optimize your in-store and digital performance using modern measurement techniques.
The Broken Feedback Loop in Retail
The fundamental problem in retail is the disconnect between impression and transaction.
If you run an eCommerce-only brand, tracking is relatively linear (though privacy laws are making even that harder). You run an ad, someone clicks, they buy. You have a digital paper trail.
In retail, that trail goes cold the moment a customer puts down their phone and walks out the door.
According to research by Harvard Business Review, retailers who successfully integrate offline and online data see significantly higher ROI, yet many still struggle with siloed measurement. The gap between digital spend and physical foot traffic is where most budget is wasted.
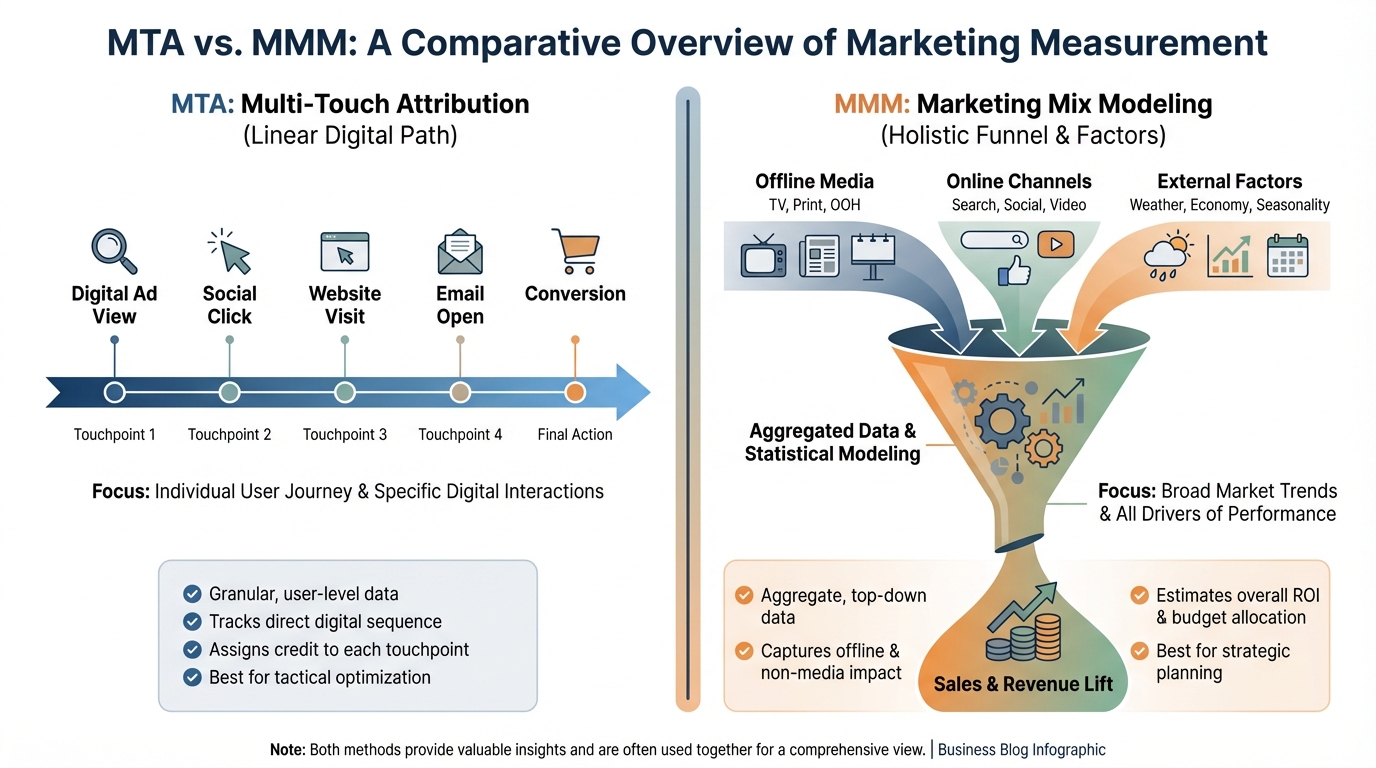
Traditional models, like Multi-Touch Attribution (MTA), fail here. They require user-level tracking ID matches. They cannot track a user who saw a YouTube ad and then paid cash at a register three days later.
To understand the true impact of your spend, you need to zoom out. You need a top-down approach. You need to understand the difference between tracking individuals and measuring aggregate impact.
For a deeper dive into why individual tracking fails where holistic modeling succeeds, read our breakdown on the MTA vs. MMM marketing attribution comparison.
Why Marketing Mix Modeling Retail Strategies Matter Now
Marketing Mix Modeling (MMM) isn't new. Big CPG brands have used it for decades.
What is new is the speed and accessibility. Historically, MMM was slow, expensive, and delivered by consultants in bad suits six months after the campaign ended. That doesn't work for modern retail. You have weekly circulars, flash sales, and changing inventory.
Modern MMM uses machine learning to ingest data in near real-time. It correlates your marketing spikes with your sales spikes, controlling for outside variables.
Here is why it is the only viable path forward for the industry:
- Privacy is Non-Negotiable: With cookies gone and privacy regulations tightening, you can no longer spy on customers to see if they bought your product. Gartner predicts that by 2026, 75% of the world's population will have its personal data covered under modern privacy regulations. MMM doesn't need personal data. It uses aggregate data.
- The Omnichannel Reality: Your customer doesn't see "channels." They just see your brand. They see an Instagram ad, get an email, walk past a billboard, and buy in-store. True omnichannel measurement requires a tool that measures the contribution of all these touchpoints simultaneously.
- External Factors: Retail is volatile. A competitor opening a store across the street affects your sales. A snowstorm affects your sales. Inflation affects your sales. MMM isolates these variables so you don't credit your marketing for a holiday spike that would have happened anyway.
For a comprehensive look at how these models function, check out our marketing effectiveness measurement guide.
The "Halo Effect": Measuring Digital's Impact on Brick-and-Mortar
The most critical insight marketing mix modeling retail analysis provides is the "Halo Effect."
This is the lift in offline sales driven by digital media.
Most retailers severely under-invest in top-of-funnel digital channels (like YouTube or CTV) because they don't see an immediate return in their Google Analytics dashboard. They turn off the ads, and suddenly, foot traffic drops 15%.
Why? Because those digital ads were driving awareness that converted offline. Leading research from Nielsen confirms that cross-platform advertising drives significant incremental lift, often unmeasured by direct attribution tools. This is a blind spot in standard measurement.
How to Measure the Halo
To capture this, your model needs specific data inputs. You cannot just dump spend and revenue into a spreadsheet. You need granularity.
- Geo-specific data: Break down sales by store location or zip code.
- Regional media spend: Isolate ad spend by region to see if higher spend in New York correlates with higher in-store revenue in Manhattan.
- Promotional calendars: When were the sales running?
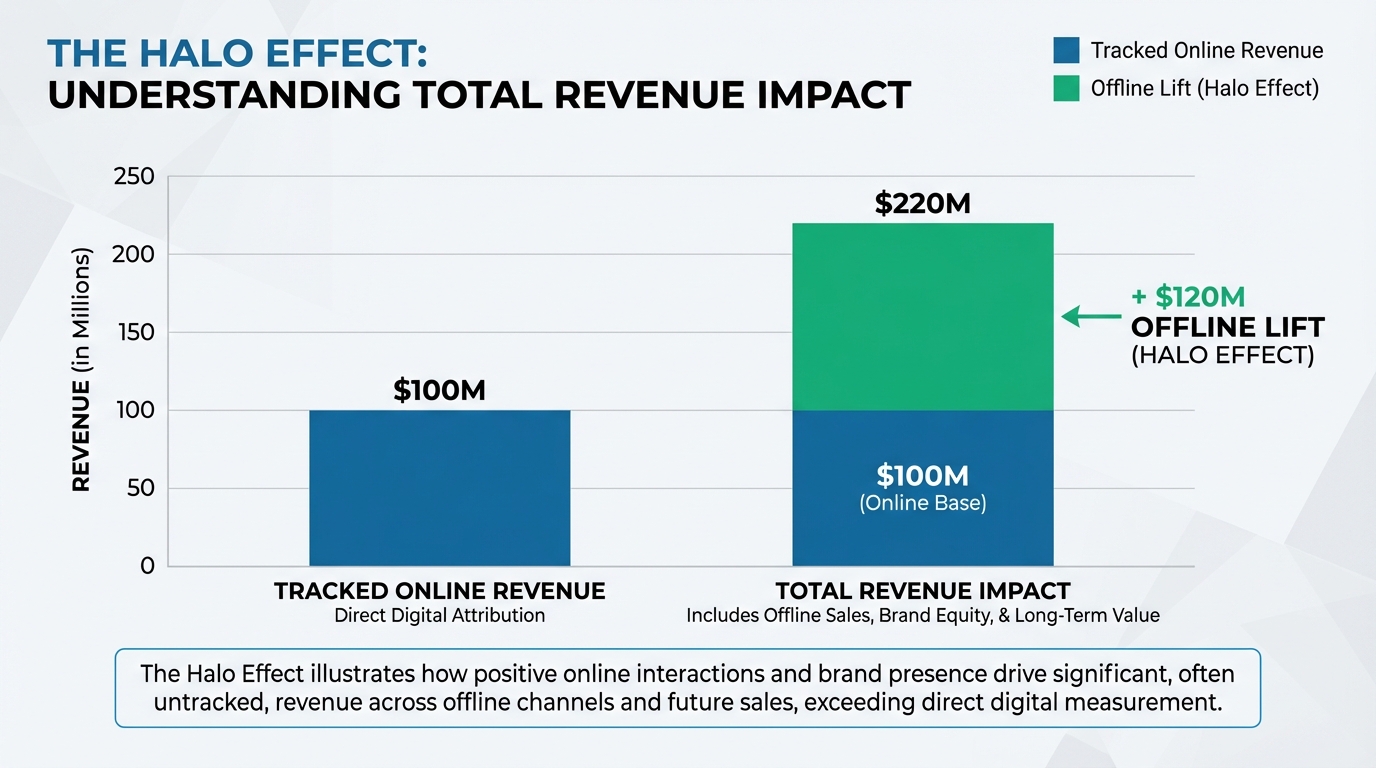
By analyzing these correlations, MMM assigns a "coefficient" to your digital channels. It might tell you that for every $1 spent on TikTok, you get $1.50 in online sales and $2.00 in in-store sales.
If you only looked at the online data, you’d cut the budget. With MMM, you double it.
This is the core of marketing ROI analysis—seeing the total return, not just the digital return.
[IMAGE: Bar graph illustrating the Halo Effect. One bar shows 'Tracked Online Revenue', a second larger bar shows 'Total Revenue Impact' including offline lift.]
Alt text: Graph demonstrating how digital ad spend drives offline retail sales.
!Graph demonstrating how digital ad spend drives offline retail sales.*
Once you understand the Halo Effect, you need to optimize for it.
Retail marketing budgets are often split into silos: the "Brand" team and the "Performance" team. This is a mistake. They are pulling levers on the same machine. According to Forrester, aligned marketing and sales teams achieve up to 24% faster revenue growth and 27% faster profit growth.
Balancing the Funnel
You need to allocate budget based on the marginal return of each channel.
- Lower Funnel (Search/Retargeting): Captures existing demand. High efficiency, low scalability.
- Upper Funnel (TV/OOH/Video): Creates new demand. Lower immediate efficiency, high scalability.
If you over-invest in the bottom of the funnel, you exhaust your audience. If you over-invest in the top, you burn cash without capturing value.
MMM helps you find the saturation point. It tells you exactly how much you can spend on Facebook before your media budget optimization hits diminishing returns.
The Role of Out-of-Home (OOH)
Retailers love billboards and transit ads. They build local density. But they are notoriously hard to measure.
You can't click a billboard.
However, MMM excels here. By inputting the dates and locations of your OOH campaigns alongside your store traffic data, the model can isolate the lift generated by those physical ads. It separates the billboard impact from the seasonal baseline.
For more on tracking physical assets, read our out-of-home advertising tracking guide.
Data Requirements for Retail MMM
Garbage in, garbage out. This cliché is the law in data science.
For a model to work, you need clean, organized data. You don't need perfect data, but you need consistent data.
1. Sales Data (The Dependent Variable)
You need daily or weekly sales volume. Crucially, this must be split by channel (Online vs. In-Store) and preferably by region.
2. Media Data (The Independent Variables)
Impressions, spend, and clicks for every channel. Facebook, Google, TV, Radio, Direct Mail. Recent data from eMarketer suggests that retail media ad spend will surpass traditional TV spend by 2028, making the integration of these data points vital.
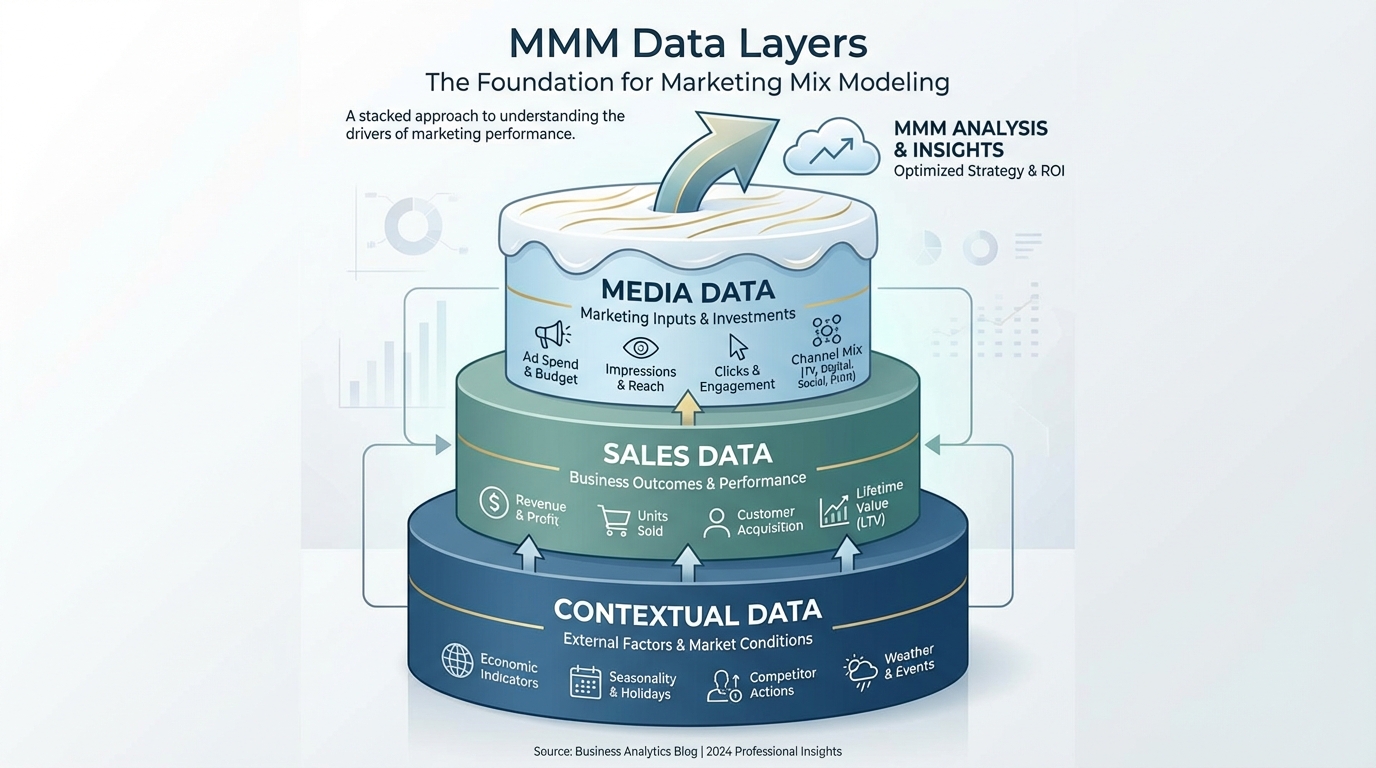
3. Contextual Data (The Control Variables)
This is where retail differs from SaaS. You must include:
- Pricing & Promotions: Did you run a 20% off sale?
- Distribution: Did you open 50 new stores?
- Competitors: Did a competitor close down?
- Macroeconomics: Unemployment rates or consumer confidence indices.
- Weather: Temperature and precipitation data for your key regions.
Leading research from McKinsey & Company highlights that integrating macroeconomic indicators into demand modeling can improve forecast accuracy by over 10%.
Collecting this data can be daunting. Many retailers use automated pipelines to aggregate this information. If you are evaluating tools to help with this data centralization, you might look at Funnel.io alternatives for marketing data platforms to find the right fit for your stack.
[IMAGE: Infographic showing the layers of data required for MMM: Media Data, Sales Data, and Contextual Data stacked like a cake.]
Alt text: The three layers of data needed for retail marketing mix modeling.
Caption: A robust model requires more than just ad spend. Context is everything.
!The three layers of data needed for retail marketing mix modeling.*
You are ready to stop guessing. How do you actually build this?
Step 1: Define Your Scope
Are you modeling total company sales? Or just a specific category like "Footwear"? Start small. If you try to model everything at once, you will get stuck in analysis paralysis.
Step 2: Choose Your Methodology
You have three options:
- Build In-House: Hire data scientists and use open-source libraries. If you have the engineering resources, check our Google Meridian MMM guide or our Meta Robyn open source MMM guide.
- Legacy Consultants: Hire a big firm. Expect to pay six figures and wait months.
- SaaS MMM Platforms: Use a platform like BlueAlpha that automates the ingestion and modeling process, giving you insights in days, not months.
Step 3: The Calibration Phase
The model will output results. You need to validate them.
Run a "lift test." The model says Facebook drives 20% of in-store sales? Okay, turn off Facebook in Ohio for two weeks. Did sales drop by roughly 20%? If yes, the model is calibrated. If not, retrain the model.
For a detailed walkthrough of this process, refer to our guide on how to deploy a media mix model.
Advanced Retail Tactics: Account-Based and Influencer Measurement
Retail isn't just B2C. Many retailers have B2B divisions (wholesale).
If you are selling bulk to other distributors, your marketing looks different. It’s more targeted. You need to understand how your marketing touches specific high-value accounts. This requires a blend of MMM and attribution. Learn more in our account-based marketing attribution guide.
On the flip side, consumer retail is heavily driven by creators.
Influencer marketing is notoriously difficult to track because the "impression" happens on the influencer's feed, not your ad account. According to Retail Dive, influencer marketing ROI is now a top-three priority for CMOs in the retail sector. However, by tracking spend and posting dates against sales spikes, MMM can quantify the value of your influencer program, even without affiliate codes.
Check out our influencer marketing performance measurement guide for specifics on this channel.
Comparing the Tools: Finding the Right Fit
The market is flooded with measurement tools. Choosing the wrong one can set you back a year.
The "Shopify-First" Tools
Platforms like Triple Whale or Northbeam are fantastic for pure-play eCommerce (DTC). They excel at tracking Shopify pixels. However, they often struggle when you introduce complex offline data or massive retail footprint data.
If you are currently using one of these and hitting a wall with your offline data, it might be time to compare.
The Legacy Heavyweights
Companies like Nielsen offer incredible depth but lack agility. If you need to make budget decisions this week, waiting for a quarterly report isn't an option.
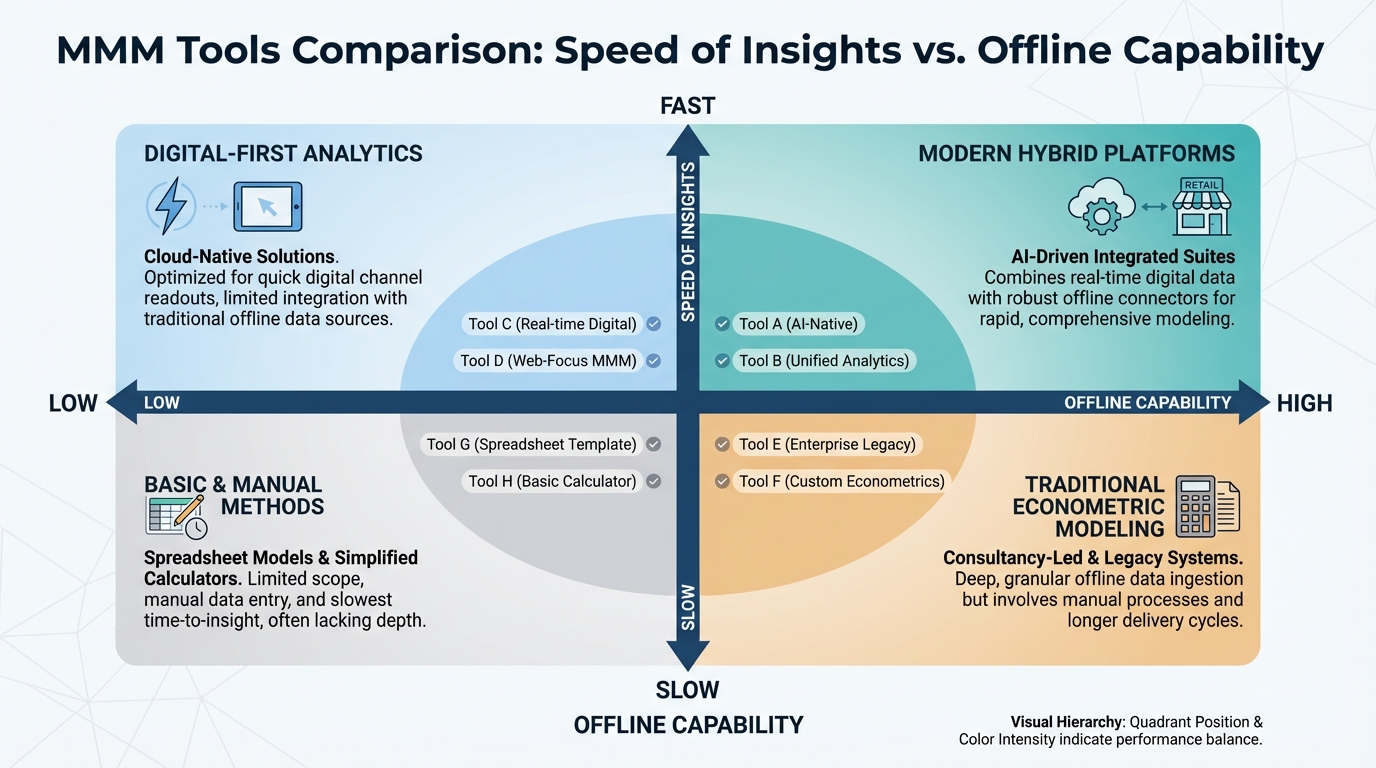
The Modern Hybrids
Platforms like BlueAlpha sit in the sweet spot. They handle the complexity of offline retail data (POS integration, seasonality) but deliver insights with the speed of a SaaS platform.
Other tools in this space include Recast and Measured. It is worth evaluating how each handles the specific nuances of retail inventory and regionality. G2 Crowd offers peer reviews that can help verify if a platform truly supports omnichannel measurement or just claims to.
[IMAGE: Matrix chart comparing different MMM tools based on 'Speed of Insights' vs 'Offline Capability'.]
Alt text: Comparison matrix of marketing measurement tools for retail.
Caption: Choose a tool that matches your business model. Pure DTC tools often fail at physical retail measurement.
!Comparison matrix of marketing measurement tools for retail.*
Avoid these mistakes to ensure your marketing mix modeling retail project succeeds.
1. Ignoring Lag Effects
A TV ad you run today might drive a sale next week. If your model only looks at "same-day" impact, you will undervalue brand media.
2. Over-fitting the Model
You can torture data until it confesses to anything. If your model fits historical data perfectly (R-squared of 0.99), it’s probably broken. It won't predict the future; it just memorized the past.
3. Siloed Teams
If your finance team uses one set of numbers and your marketing team uses another, MMM will fail. It requires a single source of truth.
For a broader look at different modeling approaches, see our media mix modeling comparison.
Conclusion: The Future is Hybrid
The line between "digital marketing" and "marketing" is gone.
Your customer lives online and offline. Your measurement must do the same.
Marketing mix modeling retail strategies are no longer a luxury for Fortune 500 companies. They are a survival requirement for any retailer spending significant budget across multiple channels.
You have the data. You have the sales. The only thing missing is the math to connect them.
Stop optimizing for clicks. Start optimizing for revenue.
Ready to see the full picture? Book a demo with BlueAlpha today and start measuring your true retail ROI.
Frequently Asked Questions
What is the difference between MTA and MMM for retail?
MTA (Multi-Touch Attribution) tracks individual user paths via clicks and cookies, which is difficult for offline sales. MMM (Marketing Mix Modeling) uses statistical analysis of aggregate data to measure the impact of all channels on total sales, making it superior for measuring in-store lift.
How much historical data do I need for retail MMM?
Ideally, you need at least two years of historical sales and media data. This allows the model to account for seasonality, holidays, and year-over-year trends effectively.
Can MMM measure the impact of price changes?
Yes. A robust retail MMM should include pricing variables. This allows you to distinguish between sales driven by marketing and sales driven by discounts or price cuts.
Does MMM work for small retailers?
MMM requires a certain volume of data to be statistically significant. Generally, if you are spending over $20k-$30k per month on media and have consistent sales volume, MMM can provide actionable insights.
How often should I update my model?
In the past, models were updated annually. Today, continuous calibration is best. Platforms like BlueAlpha allow for weekly or monthly updates, enabling you to adjust budgets in near real-time.