Marketing Mix Modeling Small Business: The Growth Guide
Stop guessing with your ad spend. Learn how marketing mix modeling small business strategies can fix your attribution and boost ROI. Start optimizing today.
You have a problem. You’re spending money on Facebook, Google, maybe some TikTok, and perhaps an email newsletter. Your dashboard says one thing. Your bank account says another.
For years, accurate measurement was a luxury reserved for the Coca-Colas and Unilevers of the world. They had the data scientists. They had the millions to spend on enterprise software.
That era is over.
Marketing mix modeling small business strategies are no longer optional. They are the survival kit for the post-cookie internet.
If you are relying solely on click-based tracking (like Google Analytics or Facebook Ads Manager), you are flying blind. You are optimizing for clicks, not revenue. This guide breaks down exactly how MMM for startups and SMBs can deploy sophisticated measurement without the enterprise price tag.
The Attribution Crisis Hitting Small Business
Let’s be real about the current state of digital marketing.
Privacy changes from Apple (iOS14+) and Google have shattered the traditional tracking model. The pixel is dying. If you run a small business, you’ve likely seen your customer acquisition cost skyrocket while your reported ROAS (Return on Ad Spend) plummets.
The platforms aren't just guessing; they are grading their own homework. Facebook will claim a sale. Google will claim the same sale. Your email platform claims it too.
According to the Interactive Advertising Bureau (IAB), the signal loss from third-party cookie deprecation is costing advertisers billions in lost efficiency. You cannot afford to lose efficiency.
Furthermore, Statista reports that global opt-in rates for app tracking hover around 25%, meaning you are missing data on three out of every four customers on iOS.
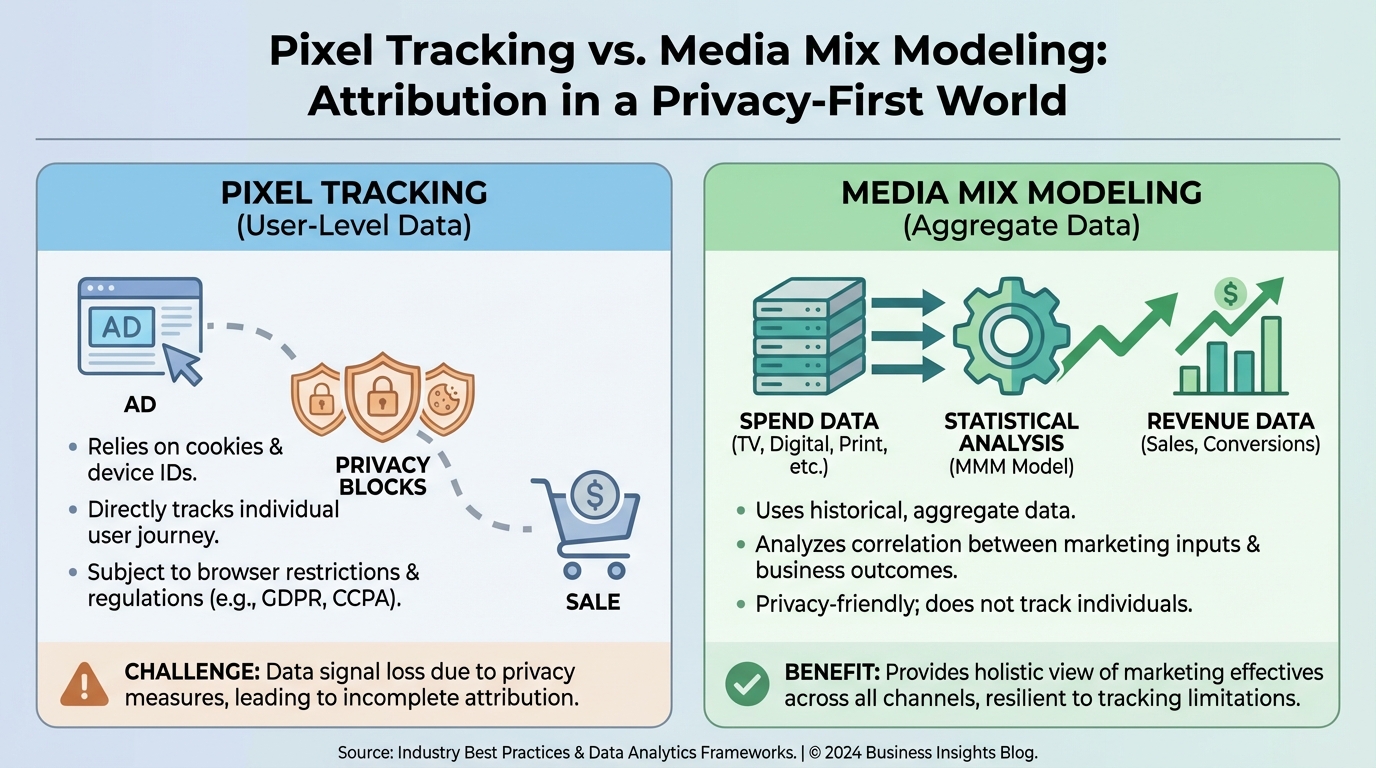
This is where Media Mix Modeling (MMM) steps in. Unlike tracking pixels that follow a user around the internet, MMM uses statistical analysis to look at the big picture. It correlates your spend spikes with your revenue spikes.
It respects data privacy because it doesn't care about who bought your product. It cares about what marketing pressure caused the sale. This is the future of marketing attribution for SMBs.
For a deeper dive into the mechanics, read our media mix model marketing attribution guide.
!Diagram comparing broken pixel tracking versus holistic media mix modeling for small business.*
Why MMM Was Previously Out of Reach (And Why It Isn't Now)
Historically, MMM had three high barriers to entry:
- Data Requirements: You needed years of historical data.
- Cost: Consultants charged $50k+ per model refresh.
- Latency: You got results months after the campaign ended.
Technology has democratized this. Computing power is cheaper. AI has automated the heavy lifting of statistics.
Today, lightweight media mix modeling can run on as little as 6-12 months of data. You don't need a PhD in statistics. You just need organized spreadsheets and the right tools.
This shift allows startups to move away from "last-click" attribution—which overvalues bottom-of-funnel ads like branded search—and understand the true value of brand awareness.
According to a recent report by McKinsey, companies that integrate MMM into their strategy can see marketing efficiency gains of 15-30%. For a startup operating on a thin runway, that efficiency is the difference between Series A and shutting down.
To understand how to measure this effectively, check our marketing effectiveness measurement guide.
Prerequisites: Is Your Startup Ready for MMM?
Not every lemonade stand needs a statistical model. But you might be ready sooner than you think.
Here is the checklist to determine if you are ready to implement a model:
- Monthly Ad Spend: Are you spending at least $5,000 - $10,000 per month across 2+ channels?
- Data Consistency: Do you have at least 6 months of daily or weekly data for spend and revenue?
- Channel Diversity: Are you running ads on Meta, Google, and perhaps experimenting with others?
- Variable Spend: Have you varied your budget? (If you spend exactly $100/day every day, the model can't learn what happens when spend changes).
If you check these boxes, you are ready to move beyond basic spreadsheets. You need to verify your returns using a marketing ROI analysis guide.
Step 1: Data Collection and Hygiene
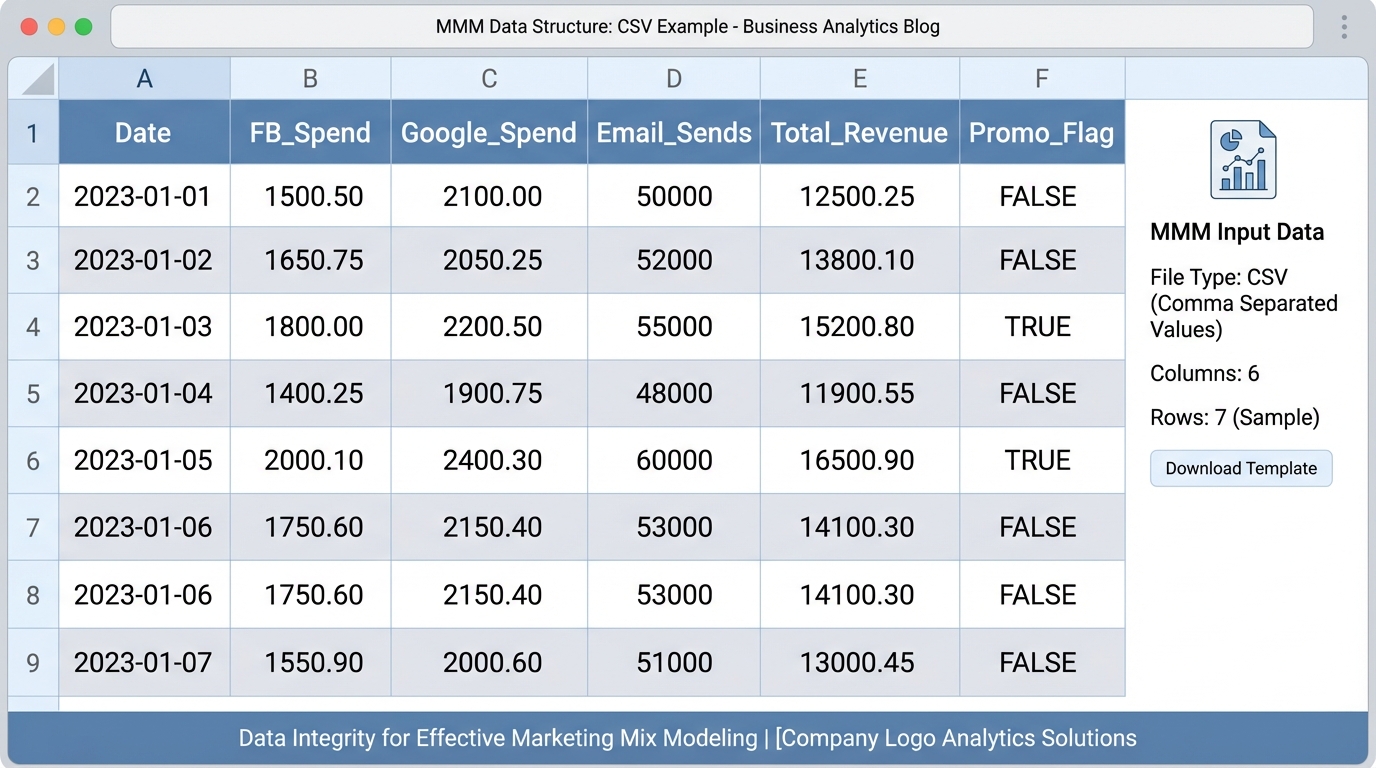
Garbage in, garbage out. This is the golden rule of data science.
For a small business, your advantage is agility. You don't have data silos like a Fortune 500 company. You can likely pull everything you need in an afternoon.
You need three core datasets:
- Media Data: Date, Channel, Spend, Impressions, Clicks.
- Sales Data: Date, Revenue, New Customers, Total Orders.
- Contextual Data: Price changes, major holidays, competitor promotions, website outages.
Don't ignore the contextual data. If your sales spiked on Black Friday, the model needs to know that wasn't just because of your Facebook ads. It was the calendar.
Gartner emphasizes that poor data quality is a primary reason marketing analytics initiatives fail. Clean your data before you model it.
If you are using Google's ecosystem, our Google Meridian MMM complete guide offers specific data formatting tips.
[IMAGE: Screenshot of a clean CSV spreadsheet structure for MMM. Columns include Date, FB_Spend, Google_Spend, Email_Sends, Total_Revenue, Promo_Flag.]
Alt text: Example of proper data formatting for marketing mix modeling small business.
!Example of proper data formatting for marketing mix modeling small business.*
Once you have the data, you have a choice. Do you use open-source code, or do you pay for a platform?
The Open Source Route
If you have a technical founder or a data analyst on the team, you can use open-source libraries.
- Meta Robyn: This is Facebook's open-source package. It’s powerful but requires R programming knowledge. Read our Meta Robyn open source MMM guide to see if you have the technical chops.
- LightweightMMM: A Python-based library that popularized lightweight media mix modeling.
Pros: Free (monetarily).
Cons: Expensive (time-wise). Requires coding skills. No user interface.
The SaaS Route
For most small businesses, you want answers, not code. You need MMM for startups that works out of the box.
Platforms like BlueAlpha bridge this gap effectively. BlueAlpha specifically designed its platform with startups in mind, offering enterprise-grade modeling at SMB-friendly price points. It ingests your data, runs complex regression models, and provides a dashboard you can actually read.
This allows you to focus on strategy rather than debugging Python scripts. When evaluating tools, you might look at comparisons like Lifesight vs BlueAlpha AI to understand why specialized tools often outperform generalist platforms.
Step 3: Interpreting the Output
You ran the model. Now what?
The model will give you a few key metrics for your marketing mix modeling small business strategy.
Contribution Charts
This tells you what percentage of sales came from each channel. You might find that while Google Analytics says Facebook drives 10% of sales, the MMM reveals it drives 30%. This is common because Facebook builds demand that Google captures later.
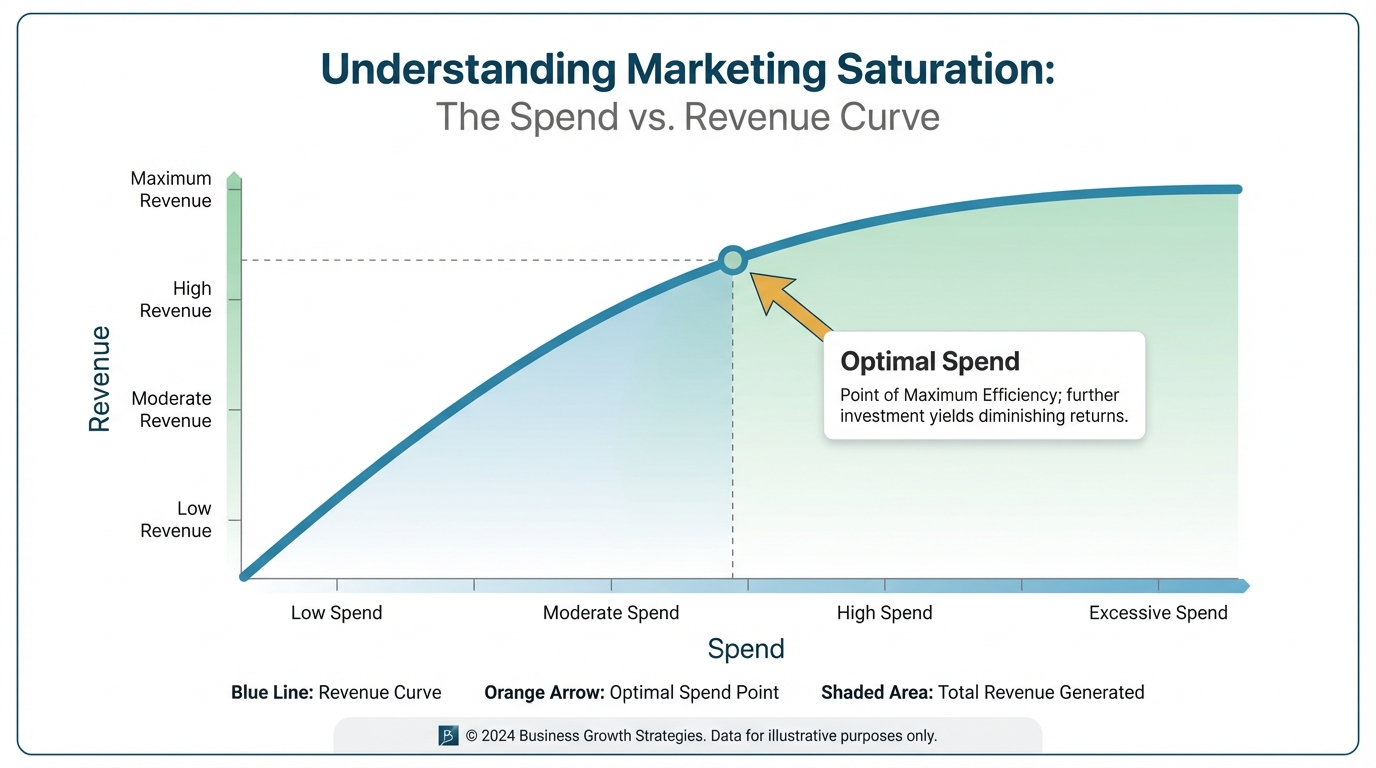
Saturation Curves
This is critical for budget allocation for small business. Every channel has a diminishing point of return. Spending $1,000 might get you 10 customers. But spending $10,000 might only get you 50 customers.
The model visualizes this curve. It tells you exactly where to stop spending on Facebook and start spending on TikTok. This ensures maximum ad spend efficiency.
Nielsen reports that 50% of media plans are under-invested, meaning brands are leaving money on the table by not hitting the optimal saturation point.
This concept is the core of our media budget optimization guide.
[IMAGE: Line graph showing a saturation curve. The X-axis is Spend, Y-axis is Revenue. The line goes up steeply then flattens out. An arrow points to the "Optimal Spend" point before the curve flattens.]
Alt text: Saturation curve chart demonstrating ad spend efficiency.
Caption: Stop burning cash. Identify exactly where your ad spend stops being profitable.
!Saturation curve chart demonstrating ad spend efficiency.*
A common objection is: "I'm a startup, I don't have historical data."
It is valid. However, you can use MMM to calibrate your experiments.
If you launch a new channel—say, Influencer Marketing—you won't have years of history. But you can run a "geo-lift" test. Run the influencer campaign in California and Texas only. Keep everything else constant.
Compare the sales lift in those regions against the rest of the country. Feed that data into your model. This is how you achieve accurate marketing attribution for SMBs even with new channels.
This is particularly useful for channels that are notoriously hard to track, like podcasts or billboards. If you are investing in physical ads, read our out of home advertising tracking guide.
Similarly, influencer marketing is often undervalued by click-based tools because people see the post, remember the brand, and search for it days later. A good model captures this delayed effect. See our influencer marketing performance measurement guide.
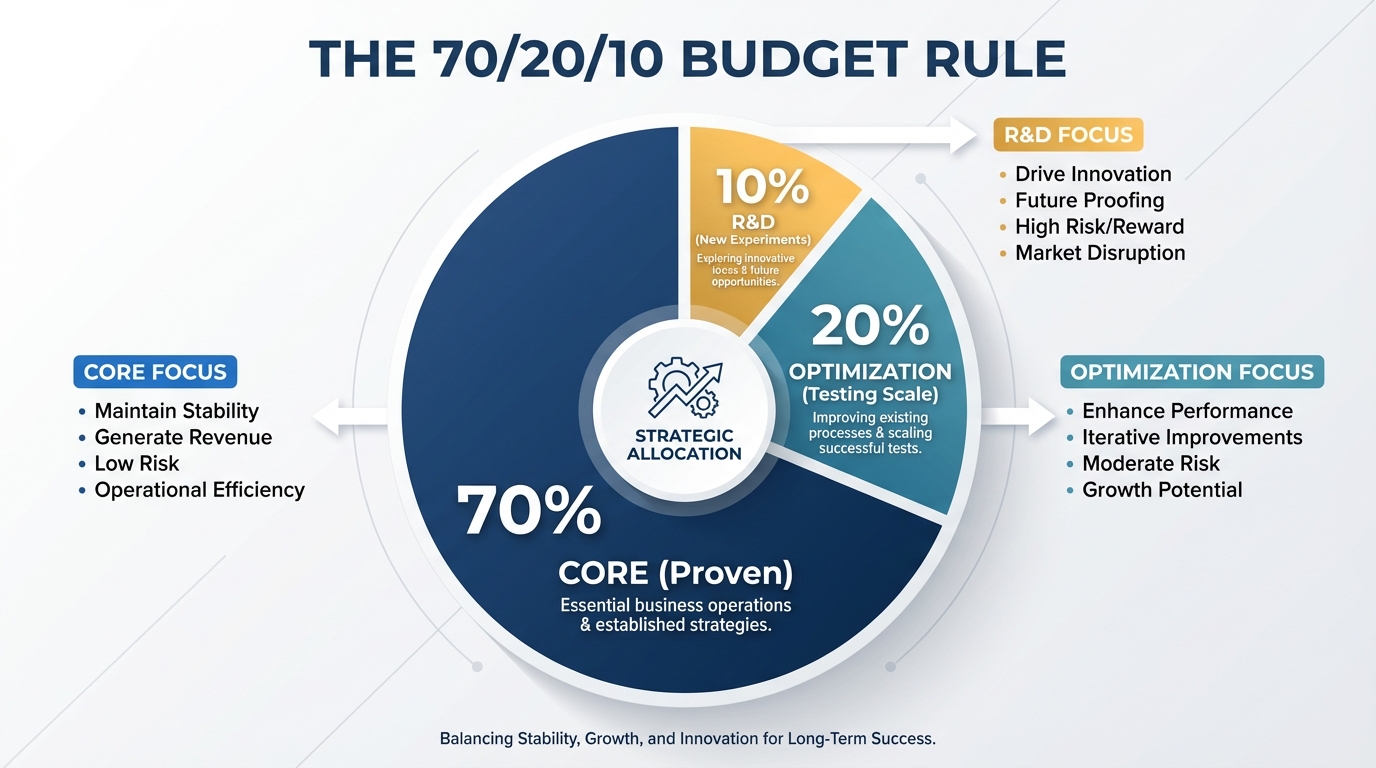
Budget Allocation: The 70/20/10 Rule
For small businesses, budget optimization for small business often follows the 70/20/10 split based on MMM insights.
- 70% Core: Put the majority of your budget into channels that your model proves are efficient and scalable.
- 20% Optimization: Use this to push the saturation limits of your core channels. Test higher spends to see if the model holds true.
- 10% R&D: Throw this at completely new channels where you have no data. This feeds the model for next quarter.
This approach ensures you are capturing demand while simultaneously building future growth. You must align these budgets with your funnel stages. Startups often over-index on bottom-of-funnel (conversion) and starve top-of-funnel (awareness).
Marketing Week notes that optimal budget allocation is often the single biggest driver of improved marketing effectiveness, surpassing even creative quality in some studies.
Use your model to balance this. Check our funnel stage budget allocation guide.
[IMAGE: Pie chart illustrating the 70/20/10 budget rule. 70% Core (Proven), 20% Optimization (Testing Scale), 10% R&D (New Experiments).]
Alt text: 70/20/10 rule for budget optimization for small business.
Caption: A balanced diet for your marketing budget.
!70/20/10 rule for budget optimization for small business.*
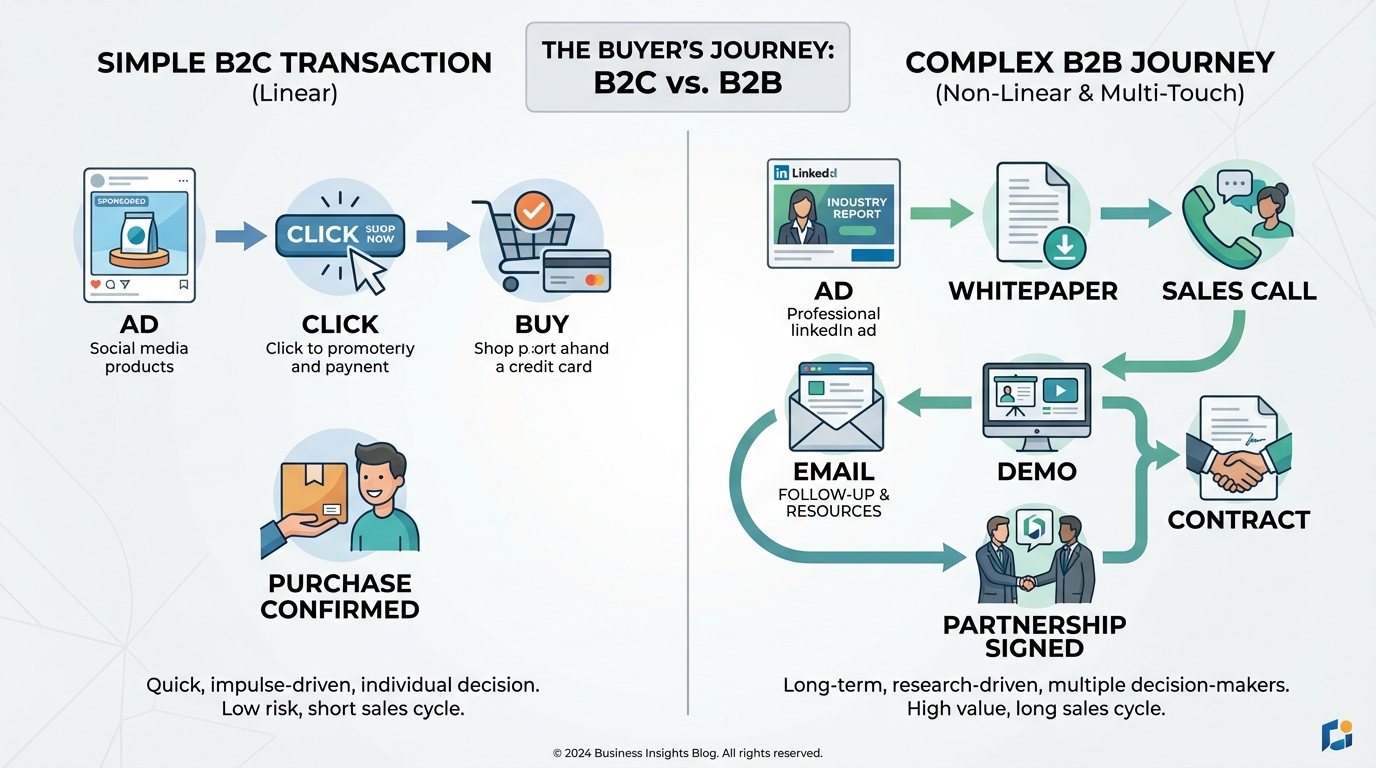
If you are a B2B startup, your sales cycle is longer. You aren't selling $20 t-shirts; you're selling $20,000 software contracts.
The marketing mix modeling small business approach for B2B requires accounting for "time lag." Your ad spend in January might not convert until March.
Standard attribution software fails miserably here. It usually gives credit to the sales rep who closed the deal, ignoring the six months of marketing that warmed up the lead. This destroys your view of marketing ROI.
For B2B founders, incorporating Account-Based Marketing (ABM) data into your model is vital. Learn more in our account based marketing attribution guide.
Furthermore, B2B models must be stricter about data privacy when handling lead lists. MMM aggregates data, making it a safer bet for compliance than tracking individual user behavior across long sales cycles.
[IMAGE: Split screen illustration. Left side shows a simple B2C transaction (Ad -> Click -> Buy). Right side shows complex B2B journey (Ad -> Whitepaper -> Sales Call -> Email -> Demo -> Contract).]
Alt text: Difference between B2C and B2B marketing attribution cycles.
Caption: B2B journeys are complex. Your measurement model needs to account for time lag.
!Difference between B2C and B2B marketing attribution cycles.*
You are not alone in looking for solutions. The market is flooding with tools because the need is so high.
You might have heard of Triple Whale or Northbeam. These are popular in the ecommerce space. They primarily rely on first-party pixel data (server-side tracking). While better than standard pixels, they still face privacy headwinds and struggle with offline channels.
MMM platforms take a different approach. They don't rely on tracking individuals, making them more robust against privacy changes.
If you are currently evaluating tools for MMM for startups, it helps to see how they stack up against a dedicated modeling solution like BlueAlpha.
- Northbeam: This tool is excellent for pixel tracking and is beginning to add MMM features. However, for a pure statistical approach, you might want to compare the methodologies. See Northbeam vs BlueAlpha AI.
- Triple Whale: This is the dominant player for Shopify stores. It offers a great dashboard, but its core strength remains attribution rather than predictive modeling. Check out Triple Whale vs BlueAlpha AI.
- Measured: This platform focuses heavily on incrementality testing. It is a powerful enterprise tool but is often too expensive for early-stage startups. See Measured.com vs BlueAlpha AI comparison.
For a broader look at the ecosystem and other options that might fit your specific tech stack, you can explore Northbeam alternatives or Triple Whale alternatives.
Common Pitfalls to Avoid
Implementing marketing mix modeling small business strategies isn't a magic bullet. You can mess it up.
1. Overfitting the Model
This is the most dangerous trap. Overfitting happens when you force the model to match the past perfectly. The model becomes so complex that it "memorizes" the data rather than learning the trends.
It looks great on a retrospective chart, but it fails to predict next month's sales. It’s like studying the specific answers to a practice test rather than learning the subject matter. You pass the practice, but fail the real exam.
MIT Sloan Management Review highlights that complex models often fail in real-world applications because they cannot adapt to new, unseen data. Simpler models are often more robust.
2. Ignoring the "Base"
Not all sales are driven by marketing. If you turn off all ads, you will still sell some product (thanks to SEO, word of mouth, and repeat customers). This is your "baseline."
If your model attributes 100% of sales to ads, it is wrong. A healthy model separates "Base Sales" from "Incremental Sales." Ignoring this leads to inflated ROI numbers and bad budgeting decisions.
3. Set It and Forget It
Market dynamics change. Seasonality changes. Your creative performance changes. You need to refresh your model at least monthly. See our guide on how to deploy media mix model for a sustainable cadence.
According to Harvard Business Review, the most successful companies treat analytics as an ongoing process, not a one-time project. They constantly feed new data to refine their predictions.
Lightweight media mix modeling requires consistent attention, not just a one-time setup.
Getting Started: Your First 30 Days
So, you are ready to stop guessing and start measuring. Here is a practical 30-day plan to implement budget optimization for small business using MMM.
Week 1: The Data Audit
Don't touch a model yet. Spend this week in your spreadsheets. Export your spend data from Facebook, Google, and TikTok. Export your order data from Shopify or Stripe. Ensure the dates align. If Facebook reports in UTC and Shopify reports in EST, your model will break. Standardize everything.
Week 2: Establish the Baseline
Before modeling ads, look at your organic performance. How many sales do you get on days when ad spend is zero? Or, look at your email list size and organic traffic. This gives you a rough idea of your "Base." This mental anchor prevents you from blindly accepting a model that claims ads drove 100% of revenue.
Week 3: Run the Initial Model
Whether you choose an open-source library or a platform like BlueAlpha, run your first iteration. Don't look for perfection. Look for "directionally correct" insights. Does the model show a spike in sales when you ran that big July 4th promo? If not, something is wrong with