Track Website Performance: A Robust Analytics Framework
Stop guessing with data. Learn how to track website performance using a modern, privacy-first analytics framework that drives real ROI and revenue growth.
Most companies think they have a data strategy because they installed Google Analytics 4 (GA4).
They don't.
They have a data collection tactic. And usually, a messy one.
If you want to track website performance effectively in 2026, pasting a script into your header isn't enough. The landscape has shifted. Third-party cookies are history. Privacy regulations are stricter than ever. The user journey is fragmented across devices, platforms, and walled gardens.
To make sense of this chaos, you need a robust analytics framework. You need a system that captures clean, actionable data and feeds it into advanced measurement models.
This guide breaks down exactly how to build that framework. No fluff. Just the architecture you need to turn raw clicks into revenue intelligence.
The "Garbage In, Garbage Out" Reality
Before we touch a single tag, we have to address the quality gap.
Marketing teams often complain that their attribution models are broken. They blame the algorithm. They blame the platform. But 90% of the time, the problem is the source data.
According to research by Harvard Business Review, only 3% of companies’ data meets basic quality standards. If your event tracking is inconsistent, your Media Mix Model (MMM) will fail. If your UTM taxonomy is a mess, your ROI analysis will be fiction.
To truly track website performance, you must treat data collection as an engineering discipline, not a marketing afterthought. This foundation is what separates companies that guess from companies that grow.
For a deeper dive into how bad data ruins measurement, read our marketing effectiveness measurement guide.
Phase 1: The Architecture of a Modern Framework
A robust framework consists of three distinct layers. If you skip one, the whole structure collapses.
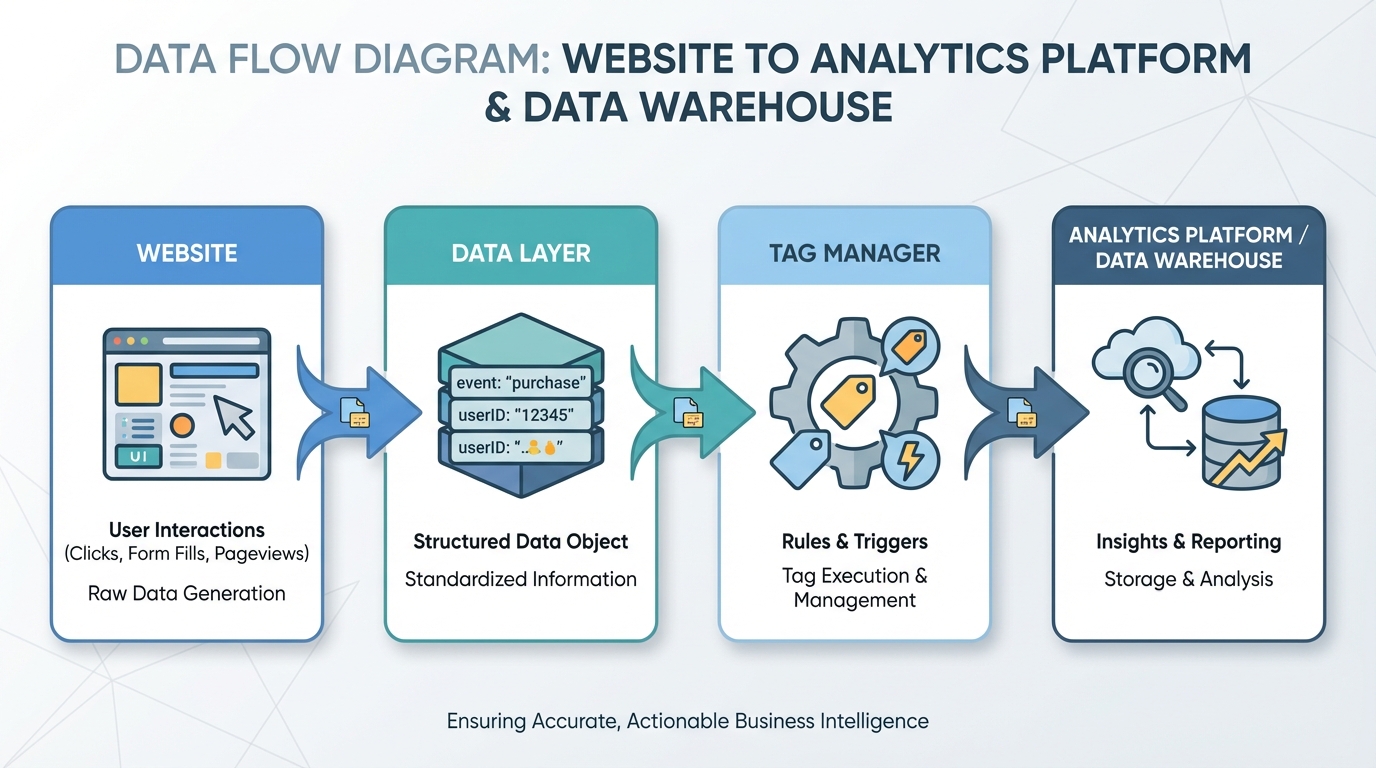
1. The Data Layer (The Foundation)
The Data Layer is a JavaScript object on your website. Think of it as a universal translator. It holds all the information you want to pass from your website (like transaction value, product ID, or user status) to your analytics tools.
Do not scrape the DOM (the visual HTML of your site) for data. If a developer changes a button color or a CSS class, your tracking breaks.
Instead, push data to the Data Layer. This decouples your tracking from your design. It is the single source of truth for your website's behavior. You can review the W3C Data Layer specifications to understand the technical standards required.
2. The Tag Management System (The Controller)
This is usually Google Tag Manager (GTM) or a similar enterprise solution. It listens to the Data Layer. When specific conditions are met (e.g., "purchase_complete" event fires), it triggers the appropriate tags.
Understanding this architecture is the first step in learning how to deploy a media mix model correctly, as models require stable inputs.
3. The Analytics Destination (The Warehouse)
This is where the data lives. It could be GA4, a data warehouse like Snowflake, or a specialized marketing analytics platform.
Phase 2: Defining What to Track
Most marketers track too much and measure too little.
"Time on page" is a vanity metric. "Bounce rate" is often misleading. To track website performance that actually impacts the bottom line, you need to map tracking to business objectives.
The Event Hierarchy
Stop thinking in "pageviews." Start thinking in "events."
- Macro-Conversions: These generate revenue. Purchases, signed contracts, demo requests.
- Micro-Conversions: These indicate intent. Newsletter signups, "add to cart," video completions, whitepaper downloads.
- Engagement Events: These show interest. Scroll depth (75%+), image gallery interactions, internal site search.
Every event you track must answer a specific business question. If you can't articulate what decision a metric will influence, delete it. This discipline is essential for effective media budget optimization later in the process.
Understanding the financial impact of these events is crucial. You can learn more about connecting metrics to money in our marketing ROI analysis guide.
Naming Conventions Matter
Standardize your naming. If one team tracks signup_form_submit and another tracks Form Submission - Signup, you have fractured data.
Create a "Data Dictionary." This is a living document that lists every event, its trigger condition, and its associated parameters. It ensures that when you analyze performance three months from now, you know exactly what you're looking at.
According to research by Gartner, organizations that maintain a centralized data dictionary significantly reduce analysis time because data scientists spend less time cleaning and more time modeling.
Phase 3: Server-Side Tracking (The New Standard)
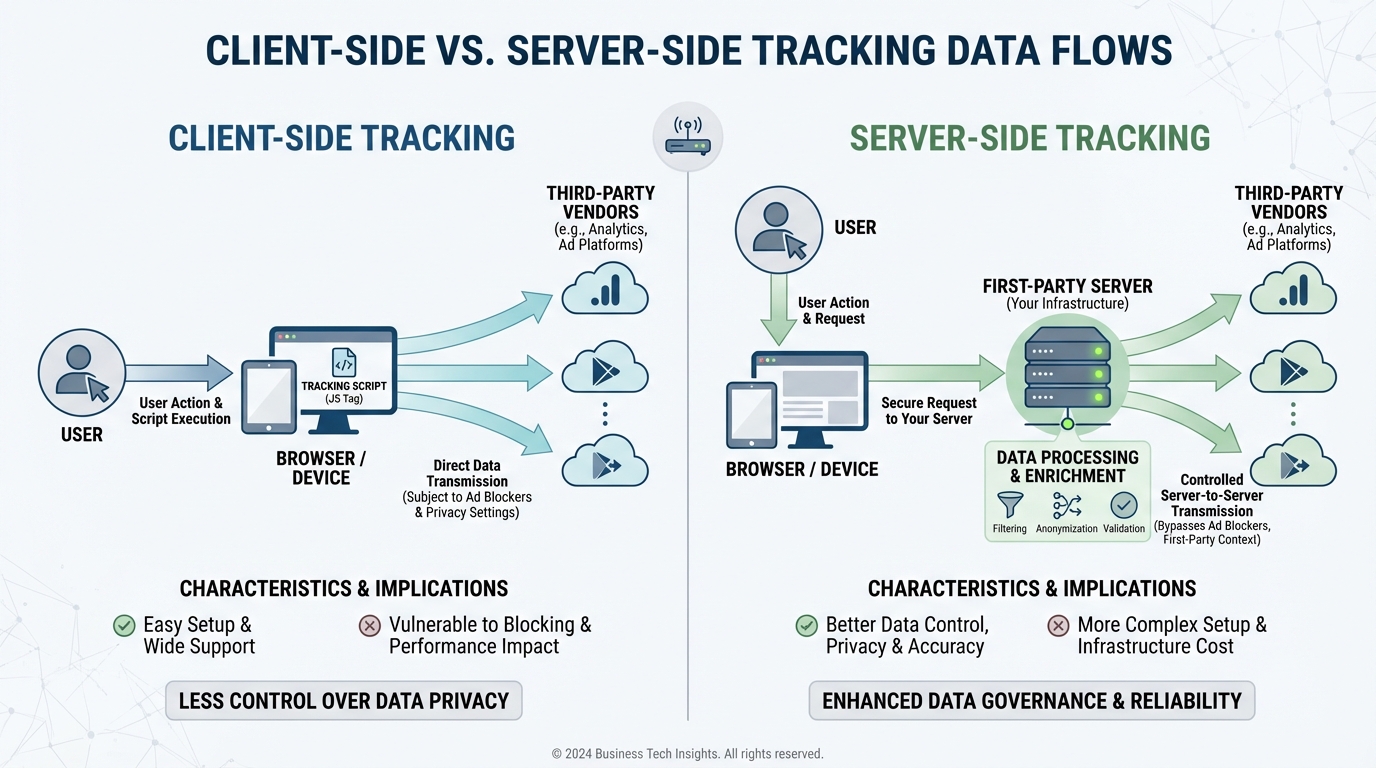
Client-side tracking (browser-based) is dying. Ad blockers, intelligent tracking prevention (ITP), and privacy browsers strip data before it ever leaves the user's device.
If you rely solely on client-side pixels, you are likely missing 15-30% of your conversions.
Why You Need Server-Side GTM
Server-side tagging moves the processing burden from the user's phone to a server you control.
- Better Data Accuracy: Ad blockers generally block scripts running in the browser. They rarely block requests sent to a first-party server subdomain (e.g.,
metrics.yourdomain.com). This combats restrictions like WebKit's Intelligent Tracking Prevention. - Improved Site Speed: Instead of loading 50 marketing pixels on the user's browser, you load one. Your server then distributes that data to Facebook, TikTok, Google, and BlueAlpha.
- Data Governance: You control exactly what data is shared with third-party platforms. You can strip out PII (Personally Identifiable Information) before it hits Facebook's servers.
This shift is technical but necessary. It provides the clean signal required for advanced measurement methodologies like Media Mix Modeling. Without it, you are feeding your models incomplete datasets.
For a comparison of how different measurement models utilize this data, check out our media mix model marketing attribution guide.
[IMAGE: Comparison chart showing Client-Side Tracking vs. Server-Side Tracking data flows]
Alt text: Visual comparison of client-side tracking where the browser sends data to multiple vendors, versus server-side where the browser sends data to one server which then distributes it.
The customer journey is non-linear. A user clicks an Instagram ad on their phone, browses your site, leaves, and returns three days later on a laptop to convert via direct traffic.
Standard analytics sees this as two users: one mobile dropout and one desktop purchaser. This breaks your attribution.
To track website performance accurately across devices, you need identity resolution.
The User ID
When a user logs in or identifies themselves (via email signup), assign them a unique, anonymized User ID. Push this ID to the Data Layer.
Your analytics platform can then "stitch" the sessions together. The mobile session and desktop session become one unified journey.
This is particularly critical for B2B companies with long sales cycles. For specific strategies on high-value account tracking, refer to our account based marketing attribution guide. Furthermore, precise identity resolution is a prerequisite for calculating accurate ABM ROI.
Phase 5: Integrating with Attribution Models
Tracking is just the collection mechanism. The value comes from interpretation.
Once you have a clean data stream (Server-side GTM + Data Layer), where does it go?
The Limitations of GA4
GA4 is great for trend analysis, but its data-driven attribution is a "black box." You don't know why it assigns credit the way it does. Furthermore, it struggles to account for offline channels or view-through conversions.
The Role of MMM and BlueAlpha
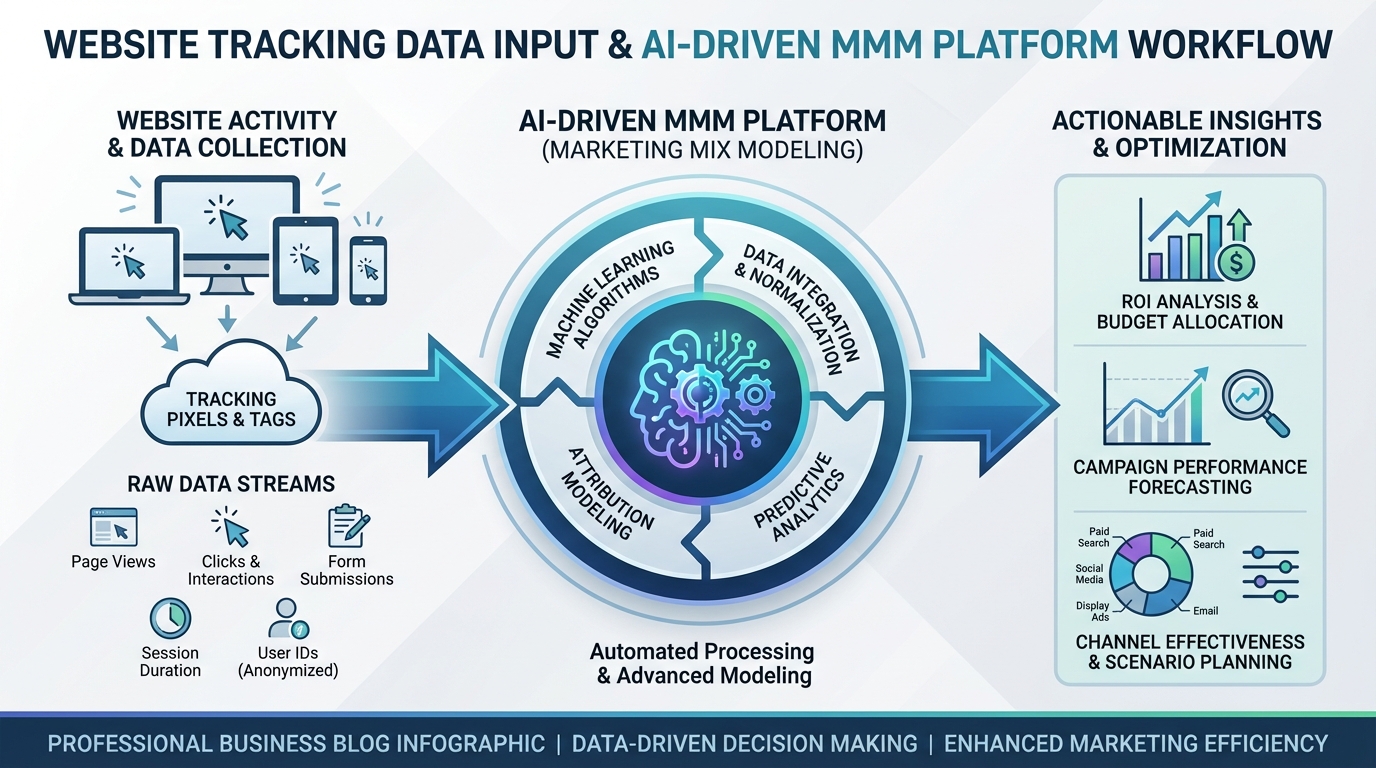
This is where Media Mix Modeling (MMM) enters the framework. MMM doesn't rely on tracking individual users across the internet (which is becoming impossible). Instead, it uses aggregate data—marketing spend, impressions, and the clean conversion data you are now collecting—to determine causality.
Platforms like BlueAlpha ingest this high-quality data to tell you exactly how much revenue each channel drives. The cleaner your website tracking, the more precise the model becomes.
If you are currently relying on Multi-Touch Attribution (MTA), you should understand why the industry is shifting toward MMM. We break down the differences in our MTA vs MMM marketing attribution comparison.
Choosing the right platform is critical. Before committing, you should review our media mix modeling comparison to see how different tools handle data ingestion.
[IMAGE: Infographic showing the input of website tracking data into an AI-driven MMM platform]
Alt text: Diagram showing raw tracking data entering an MMM engine like BlueAlpha and outputting ROI insights.
Caption: High-quality tracking data is the fuel for AI-driven marketing measurement platforms.
You cannot separate analytics from privacy. In 2026, they are the same thing.
Consent Management Platforms (CMP)
You must have a CMP (like OneTrust or Cookiebot). But simply having the banner isn't enough. You must configure "Consent Mode."
This ensures that:
- If a user denies cookies, no storage tags fire.
- "Pings" are sent to platforms like Google to model the missing data without identifying the user.
Non-compliance isn't just a legal risk; it's a data risk. If you fire tags illegally, you pollute your dataset with data you might be forced to delete later under regulations like the GDPR.
Forrester research indicates that companies with transparent privacy practices see a 25% increase in consumer trust metrics, which correlates directly with higher conversion rates.
If your current measurement stack struggles with privacy compliance, you may need to look for newer tools. We have compiled a list of Lifesight alternatives that prioritize privacy-first measurement.
Phase 7: Auditing Your Setup
A framework is not a "set it and forget it" project. Websites change. Developers push broken code. APIs update.
You need a monthly audit routine.
- The Real-Time Test: Open GA4 DebugView and click through your site. Do events fire when they should? Are parameters populating correctly?
- The Automated Crawler: Use tools like Screaming Frog with custom extraction to verify the Data Layer exists on key pages.
- The Discrepancy Check: Compare your backend database (Shopify, Salesforce) with your analytics data. If the variance is greater than 5-10%, you have a tracking leak.
If you find your current tools are creating more discrepancies than insights, it might be time to look at different platforms. We have compiled a list of Funnel.io alternatives for marketing data platforms that might better suit your infrastructure.
Advanced Tracking: Funnel and Pipeline Analytics
For SaaS and B2B companies, a website conversion is rarely the end of the road. It's just the start of the pipeline.
To track website performance fully, you must connect web events to CRM stages.
- Lead: Form fill on website.
- MQL: Marketing qualifies the lead based on data.
- SQL: Sales accepts the lead.
- Opportunity: Deal is in negotiation.
- Closed-Won: Revenue realized.
You should be passing the "GCLID" (Google Click ID) or "FBCLID" into hidden fields in your forms. This allows you to upload offline conversion data back to ad platforms later, optimizing your ads for revenue, not just leads.
For those evaluating tools to manage this pipeline data, our Funnel.io vs BlueAlpha comparison guide offers a detailed look at how different platforms handle full-funnel tracking.
Learn more about mapping this journey in our guide to pipeline attribution.
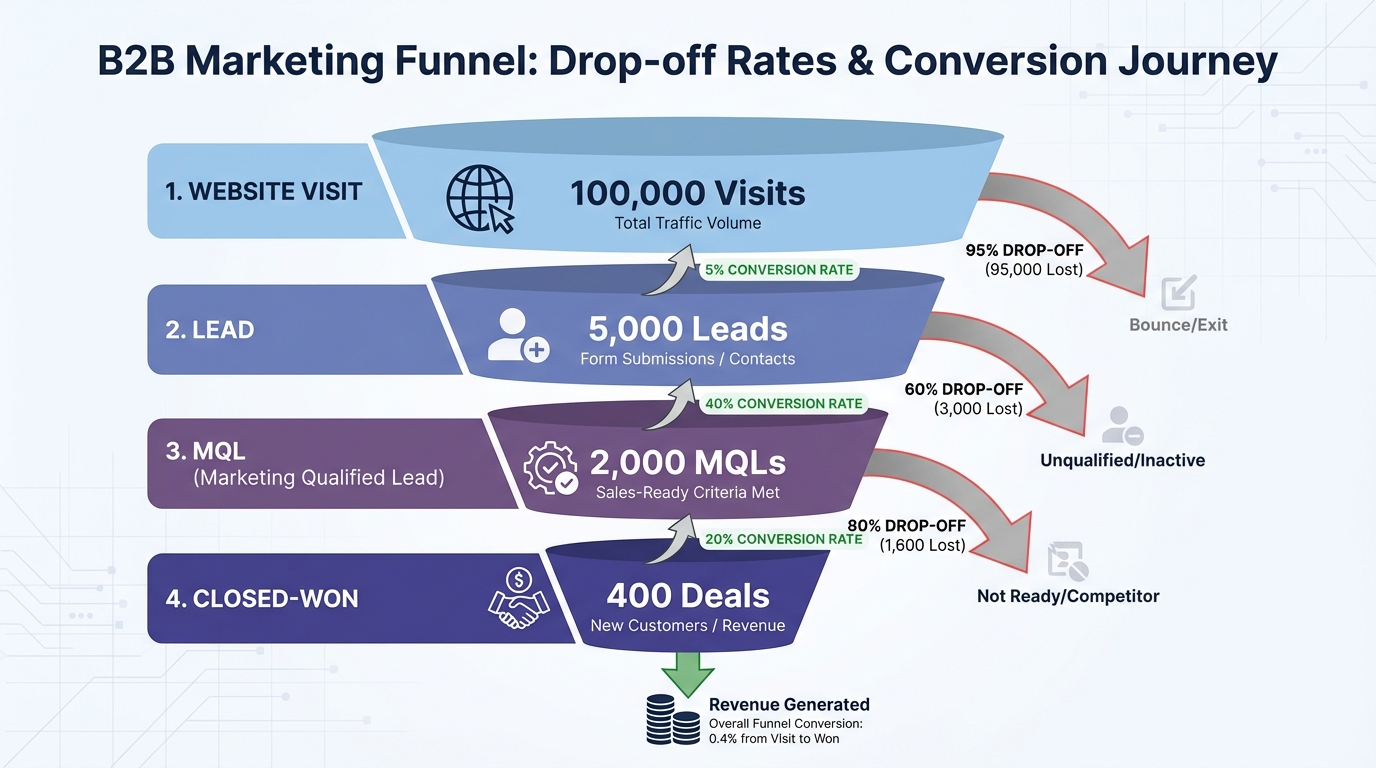
[IMAGE: Funnel visualization showing the drop-off rates between website visit, lead, MQL, and Closed-Won]
Alt text: Sales funnel chart visualizing conversion rates from website visitor to closed revenue.
Caption: Connecting web analytics to CRM data reveals the true quality of your traffic.
!Sales funnel chart visualizing conversion rates from website visitor to closed revenue.*
Once your framework is robust, you stop arguing about data accuracy and start discussing budget allocation.
With trusted data, you can see which pages assist conversions and which ones close them. You can identify that your blog posts have a high "assist" value, even if they don't drive immediate sales.
This insight allows you to move budget confidently. Instead of spreading spend evenly, you allocate based on stage efficiency. For a detailed breakdown on how to execute this, read our funnel stage budget allocation guide.
Conclusion
Building a framework to track website performance is an investment. It requires developer time, tag management expertise, and ongoing maintenance.
But the alternative is flying blind.
In an era where AI and machine learning dictate marketing success, data is your competitive advantage. According to McKinsey, the ability to activate data at scale is the defining factor for future marketing growth.
Algorithms like those used by BlueAlpha crave high-fidelity signal. Give them garbage, and they will waste your budget. Give them a structured, server-side, privacy-compliant data stream, and they will uncover growth opportunities your competitors can't even see.
Start with your Data Layer. Audit your events. Move to the server. The sooner you fix your foundation, the sooner you can trust your numbers.
FAQ
Q: Does server-side tracking replace Google Analytics?
A: No. Server-side tracking is a method of sending data to Google Analytics (and other tools). It changes how the data travels, not where it ends up. It improves accuracy and control.
Q: How often should I update my Data Layer?
A: You should update your Data Layer whenever you add new features or change the functionality of your website. It should be part of your standard web development sprint cycle.
Q: Can I track website performance without cookies?
A: Yes, to an extent. You can track basic interactions and page loads without persistent identifiers. However, attribution becomes difficult. This is why methods like Media Mix Modeling (MMM) are essential—they measure impact without needing to track individual users via cookies.
Q: What is the difference between an event and a conversion?
A: An event is anything that happens on your site (a click, a scroll, a page load). A conversion is an event that you have defined as valuable to your business (a purchase, a signup). All conversions are events, but not all events are conversions.