Marketing Mix Modeling for B2B & SaaS: Complete Guide
Discover how marketing mix modeling b2b strategies unlock true ROI. Learn to measure complex sales cycles and optimize budgets beyond last-click attribution.
B2B marketing attribution is broken.
You spend months nurturing leads. You run LinkedIn ads, host webinars, attend conferences, and send endless email sequences. A prospect finally books a demo six months later. They come in through a "Direct" search.
Your tracking software claims that "Direct" traffic drove the sale. You know that’s wrong. You know the webinars and the ads did the heavy lifting. But you can’t prove it.
This is the reality for most SaaS and B2B companies today. The reliance on tracking pixels and cookies has created a massive blind spot.
Enter marketing mix modeling b2b.
Historically, Marketing Mix Modeling (MMM) was the playground of FMCG giants like Coca-Cola. They didn't have click data, so they used statistics to measure impact. Today, privacy changes have forced B2B marketers to adopt these same statistical methods.
This guide breaks down exactly how MMM works for B2B, why it’s superior to click-based tracking, and how you can build a model that actually predicts revenue. To understand the financial impact of your efforts, you need a robust marketing ROI analysis guide.
Why B2B Needs Marketing Mix Modeling Now
The B2B buying journey is not a straight line. It is a messy web of touchpoints involving multiple stakeholders over long periods.
Click-based attribution fails here for two reasons. First, privacy regulations like GDPR and browser updates (ITP, iOS14+) have severed the link between ad impressions and conversions. You simply cannot track a user across devices over a six-month sales cycle anymore. For a deeper dive into these regulatory impacts, the ICO provides detailed guidance on adtech and privacy.
Second, most B2B influence happens offline or on "dark social" channels. Word of mouth, Slack communities, and podcasts drive massive awareness. None of these leave a click path.
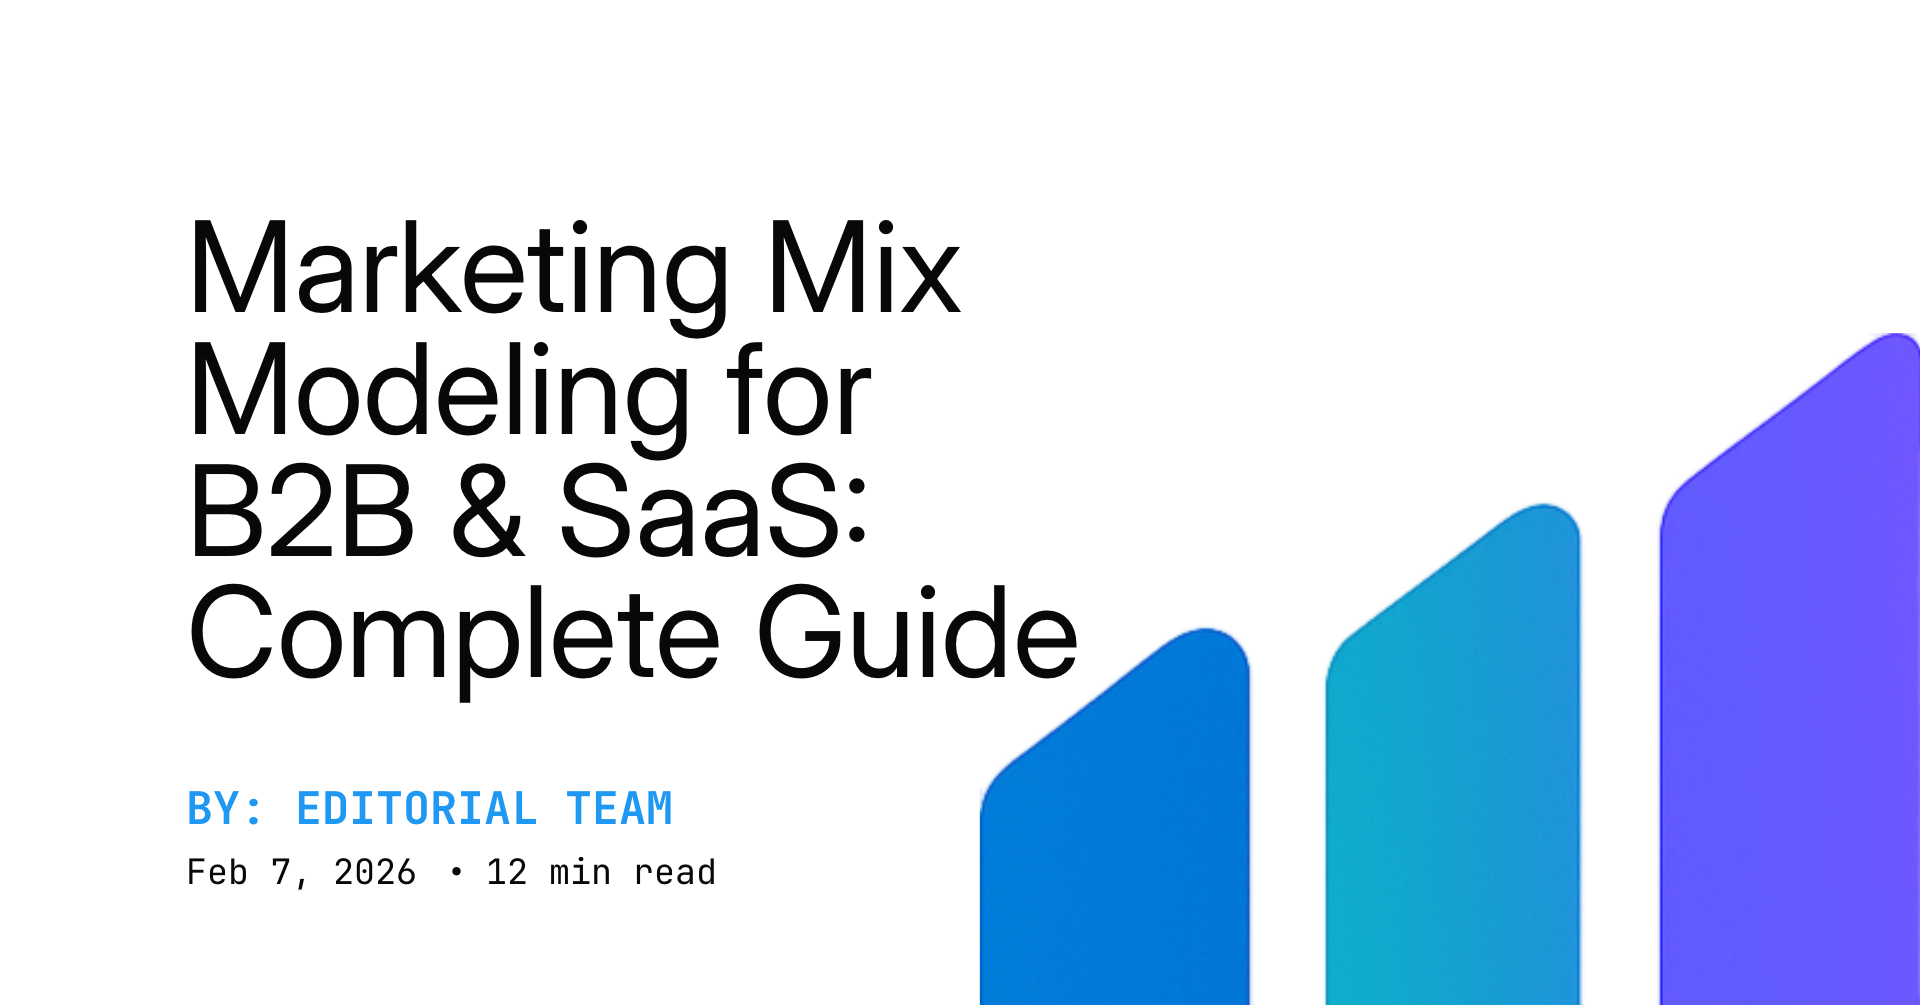
If you rely solely on Multi-Touch Attribution (MTA), you will inevitably over-invest in bottom-of-funnel channels like branded search. You need to understand the fundamental differences in our MTA vs MMM marketing attribution comparison.
To understand the full picture, you need a holistic approach. MMM doesn't care about cookies. It looks at the correlation between your marketing spend and your business outcomes (revenue, SQOs, closed-won deals) over time.
!Chart comparing Multi-Touch Attribution visibility versus Marketing Mix Modeling visibility in B2B.*
The Statistical Advantage
MMM uses regression analysis to isolate the impact of marketing activities. It accounts for seasonality, the economy, and even product changes.
For a SaaS company, this means you can finally answer the question: "Did that $50,000 LinkedIn brand awareness campaign actually generate pipeline?"
According to research by Gartner, B2B buying groups now involve six to ten decision-makers. Trying to track a single "click" to a purchase in this environment is mathematically impossible. MMM solves this by measuring the aggregate impact on the account level, rather than the individual user level.
For a foundational understanding of the math involved, review our media mix model marketing attribution guide.
How B2B MMM Differs from B2C
You cannot copy-paste a retail MMM strategy into a B2B organization. The dynamics are fundamentally different.
If you are selling sneakers, the time between an ad view and a purchase might be 24 hours. If you are selling enterprise software, it might be 24 weeks. This requires specific SaaS media mix modeling techniques.
Here are the three critical adjustments for marketing mix modeling b2b:
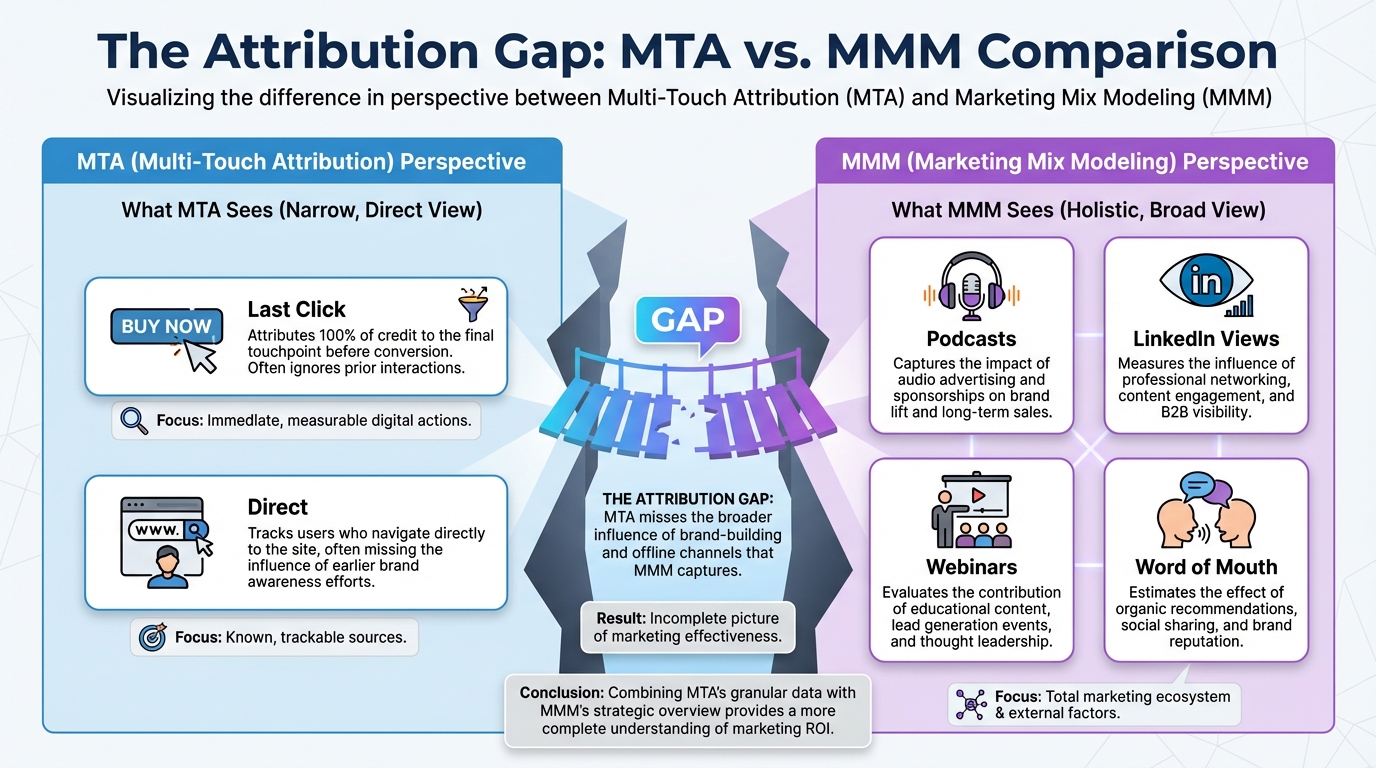
1. The Lag Effect (Adstock)
In B2B, marketing spend today generates revenue months from now. Your model must account for this delay. This is called "Adstock."
A basic model might look at weekly spend vs. weekly sales. A B2B model must look at how spend in Q1 impacts pipeline in Q3. If you don't account for these long lags, your model will tell you that your top-of-funnel marketing has zero ROI.
2. Low Data Volume
B2C companies have thousands of transactions a day. B2B companies might have 50 closed deals a quarter. Statistical models crave data volume.
To fix this, you cannot just model against "Closed Won" deals. You need to model against upper-funnel metrics that have higher volume, such as Marketing Qualified Leads (MQLs) or Sales Qualified Opportunities (SQOs).
This connects directly to pipeline attribution. You model the impact of media on pipeline creation, then apply your win rates to estimate revenue impact.
3. Account-Based Complexity
B2B marketing often targets specific accounts, not the whole market. Your model needs to understand that a spike in traffic from a specific enterprise account is worth more than a spike from generic traffic.
This requires integrating data from your ABM platforms. You need to feed the model data on account penetration and engagement. For more on this, read our account-based marketing attribution guide.
[IMAGE: Timeline diagram illustrating the "Lag Effect" in B2B. Show marketing spend in Month 1, Lead in Month 2, Opportunity in Month 4, and Closed Deal in Month 6.]
Alt text: Timeline showing the lag between B2B marketing spend and revenue realization.
!Timeline showing the lag between B2B marketing spend and revenue realization.*
Building a model sounds intimidating. It doesn't have to be. Here is the practical workflow for deploying MMM in a B2B environment.
Step 1: Data Collection and Hygiene
Garbage in, garbage out. This is the hardest part of the process. You need to aggregate data from three sources:
- Media Data: Spend, impressions, and clicks from every channel (LinkedIn, Google, Meta, OOH, Events).
- Business Data: Weekly leads, opportunities, and revenue from your CRM (Salesforce, HubSpot).
- Contextual Data: Competitor price changes, economic indicators, or sales team headcount changes.
For companies doing offline advertising, ensuring you have accurate spend data is crucial. Check our out-of-home advertising tracking guide to ensure you aren't missing these critical inputs.
Step 2: Choosing Your Modeling Approach
You have three main options for running the analysis:
- DIY (Open Source): Use libraries like Meta's Robyn or Google's Meridian. This requires a data science team.
- Consultants: Hire an agency to build a static model once a quarter. This is expensive and slow.
- SaaS Platforms: Use automated tools like BlueAlpha that ingest data continuously.
If you have a large internal data team, you might consider the open-source route. We have a detailed Meta Robyn open source MMM guide if you want to explore the code yourself. You can access the code directly on Meta's Robyn GitHub repository.
Alternatively, Google has entered the space. You can read our analysis in the Google Meridian MMM complete guide or visit the Google Meridian official page for documentation.
However, most B2B marketing leaders prefer a SaaS dashboard they can check weekly.
Step 3: Validation and Calibration
A model is just a hypothesis until proven. You must validate it.
The best way to do this is through geo-lift testing or holdout tests. If the model says LinkedIn drives 30% of your demos, turn off LinkedIn in a specific region for a month. Did demos drop by 30%?
If yes, the model is accurate. If not, recalibrate. This iterative process is detailed in our guide on how to deploy media mix model strategies.
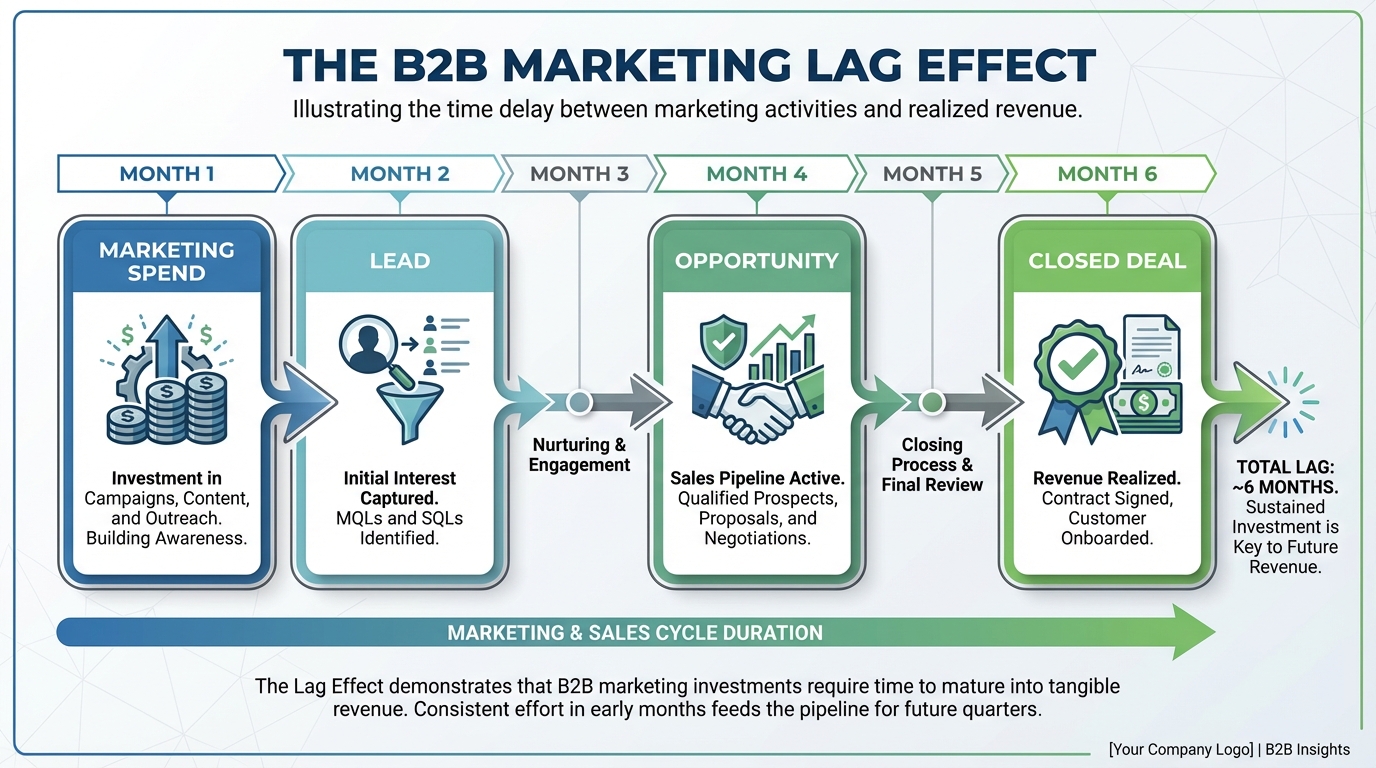
This creates a feedback loop. The model informs the experiment, and the experiment improves the model. According to Harvard Business Review, continuous experimentation is the only way to validate causal impact in marketing.
[IMAGE: Process flowchart: Data Ingestion -> Modeling Engine -> ROI Output -> Lift Test Validation -> Model Recalibration.]
Alt text: Flowchart showing the iterative process of MMM implementation and validation.
Caption: MMM is not a one-time project. It is a continuous cycle of modeling and testing.
!Flowchart showing the iterative process of MMM implementation and validation.*
B2B data is notoriously messy. Here is how to handle the specific hurdles you will face.
The "Small Data" Problem
As mentioned, low conversion volume makes regression difficult. If you only close 10 deals a month, the model will struggle to find statistical significance.
The Fix: Use micro-conversions. Instead of modeling only for "Revenue," build separate models for "Demo Requests" or "MQLs." These events happen more frequently, providing the statistical signal the model needs. You can then infer revenue based on your historical conversion rates from Demo to Close.
The Offline Gap
B2B marketers spend heavily on conferences, direct mail, and dinners. These don't have APIs.
The Fix: You must maintain a rigorous "marketing calendar" spreadsheet. Every dollar spent offline must be logged with a date and region. Without this, your model will attribute the lift from a trade show to your "always-on" search campaigns.
Influencer and Partner Marketing
SaaS companies often rely on affiliates, influencers, or integration partners. Tracking this is a nightmare in Google Analytics.
The Fix: Treat these as distinct media channels in your model. Input the spend or effort metrics associated with them. See our influencer marketing performance measurement guide for specifics on structuring this data.
Interpreting Results for Budget Optimization
Once your model is running, you get the "source of truth." Now, what do you do with it?
The goal is media budget optimization. You want to move money from low-performing channels to high-performing ones. This is the core of improving your B2B marketing ROI.
Marginal CPA vs. Average CPA
Most marketers look at Average CPA (Total Spend / Total Leads). This is misleading. You need to look at Marginal CPA (mCPA).
mCPA tells you how much the next lead will cost. You might have a low Average CPA on Google Search, but a very high Marginal CPA because you have maxed out the demand. McKinsey & Company highlights that shifting budget based on marginal returns can improve efficiency by 15-20%.
Conversely, a channel like YouTube might have a high Average CPA, but a low Marginal CPA, meaning you can scale spend efficiently.
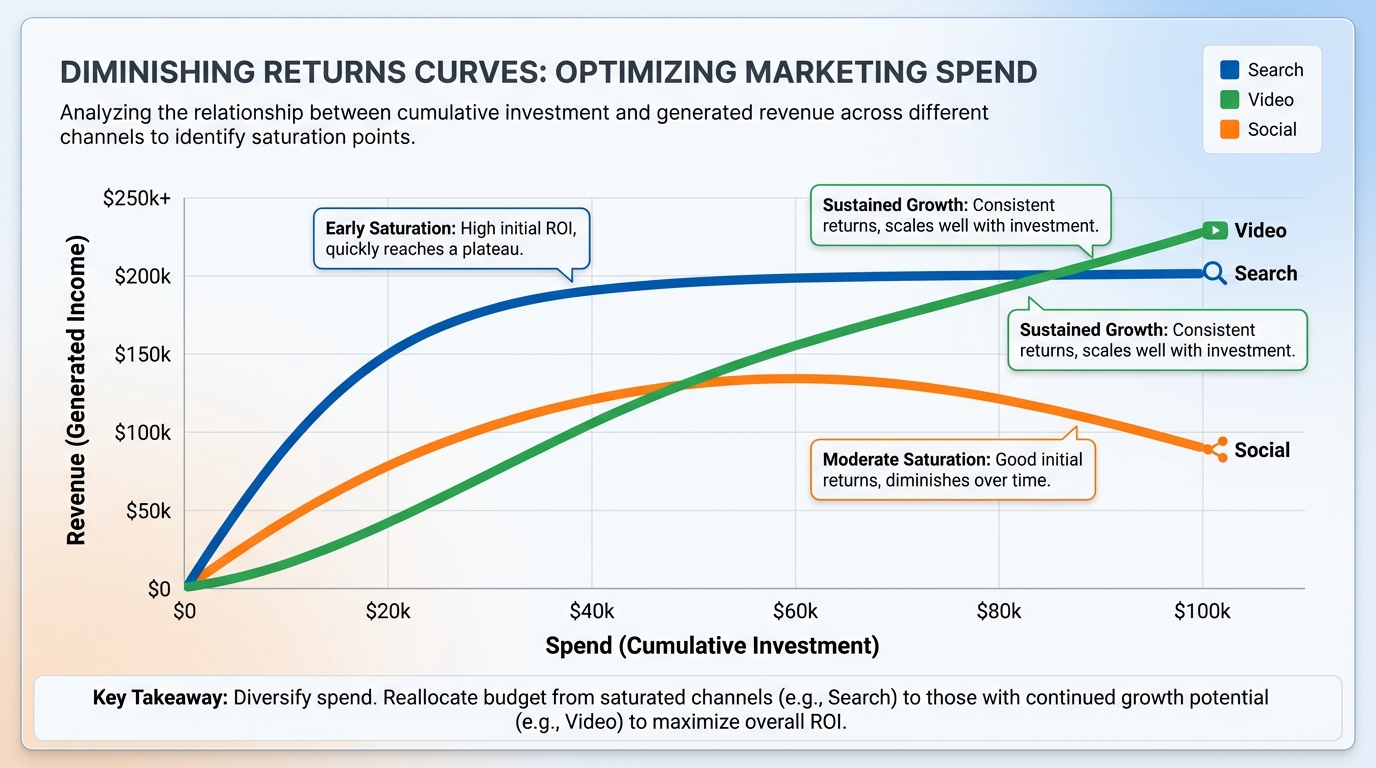
Your MMM output should provide saturation curves for every channel. These curves show you exactly where you hit diminishing returns. For a deeper look at this strategy, consult our media budget optimization guide.
Reallocating for Growth
Let’s say your model shows that:
- LinkedIn Ads are driving pipeline at a 20% lower cost than reported by MTA.
- Branded Search is claiming credit for organic traffic.
- Podcasts are driving significant lift but showing zero direct conversions.
The move? Cut Branded Search. Reallocate that budget to LinkedIn and Podcasts. Monitor the total pipeline volume.
This strategic shift is only possible when you trust the data. You must also consider where prospects are in the funnel. Learn more in our funnel stage budget allocation guide.
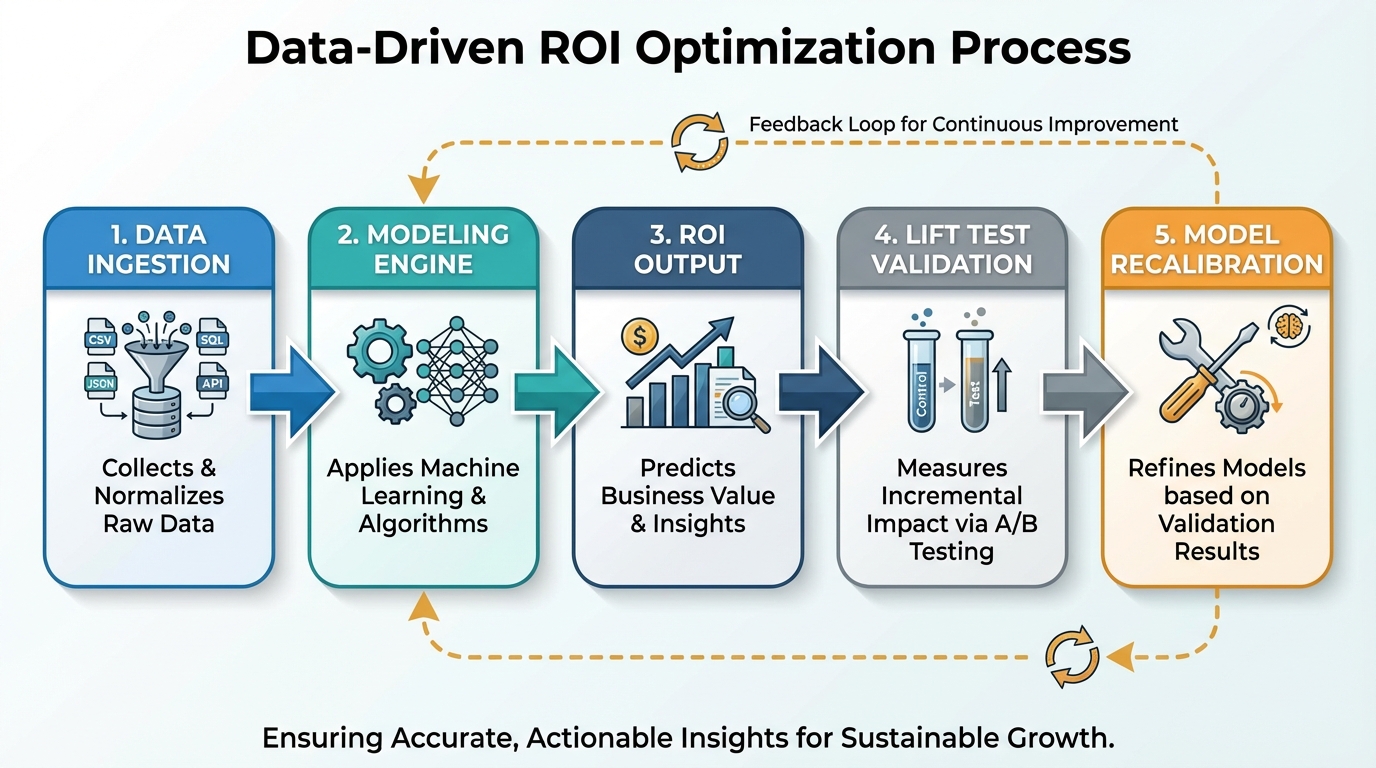
[IMAGE: Graph showing "Diminishing Returns Curves." X-axis is Spend, Y-axis is Revenue. Three lines for three channels. One line flattens out early (Search), one keeps rising (Video).]
Alt text: Saturation curves showing diminishing returns for different marketing channels.
Caption: Identify which channels have room to scale and which are maxed out.
!Saturation curves showing diminishing returns for different marketing channels.*
The market for MMM tools has exploded. B2B companies have distinct needs compared to e-commerce brands. According to Forrester's MarTech landscape analysis, the consolidation of attribution and measurement tools is a top trend for enterprise companies.
Specialized B2B Requirements
Avoid tools built strictly for Shopify stores. They are obsessed with daily ROAS and short windows. You need a platform that handles:
- CRM integration (Salesforce/HubSpot).
- Long lookback windows (6-12 months).
- Lead stage progression.
The Landscape
There are several players in the space, but few handle the intricacies of long sales cycles effectively.
BlueAlpha is designed specifically for this complexity, using AI to automate the data cleaning and modeling process that usually takes data scientists months—delivering actionable insights in days rather than quarters.
Other platforms exist, though many lean heavily toward D2C. For example, if you are evaluating Northbeam alternatives, you will find that while Northbeam is excellent for e-commerce, it struggles with the B2B sales cycle.
Similarly, tools like Triple Whale are fantastic for Shopify but lack the CRM integrations needed for SaaS. You can read more about this in our Triple Whale alternatives ecommerce analytics breakdown (which highlights the B2B gap).
For enterprise-grade needs, some look at Measured or Keen. We break down the differences in our Measured com vs BlueAlpha comparison article.
Ultimately, you want a tool that gives you actionable insights, not just a static PDF report.
FAQ
Is Marketing Mix Modeling expensive?
Traditionally, yes. Consultants charged $50k+ per project. However, modern AI-driven SaaS platforms have brought the cost down significantly, making marketing mix modeling b2b accessible for mid-market companies.
Can MMM replace Multi-Touch Attribution (MTA)?
They work best together. MMM is for high-level strategy and budgeting (Macro). MTA is for day-to-day campaign management and creative optimization (Micro). Do not throw away your tracking, but do not use it for budgeting.
How much data do I need for B2B MMM?
Ideally, you need at least 12 to 24 months of historical data. This allows the model to understand seasonality and year-over-year trends. Nielsen suggests that data granularity is just as important as volume for accurate modeling.
Does MMM work for Account-Based Marketing (ABM)?
Yes, but it requires specific configuration. You must measure lift within target account lists rather than generic market lift. Check our ABM ROI measurement guide for details.
Conclusion
The era of easy digital tracking is over. For B2B companies, this is actually good news.
It forces us to stop optimizing for vanity metrics like "clicks" and start optimizing for business value. Marketing mix modeling b2b provides the mathematical framework to link your activities to revenue.
It allows you to defend your budget to the CFO. It gives you the confidence to invest in brand, dark social, and long-term demand generation.
Don't stay in the dark. Start gathering your data, auditing your channels, and building a model that reflects the reality of your complex sales cycle.
Ready to see what your true ROI looks like?
Explore how to get started with our guide on how to deploy media mix model strategies today.