Marketing Mix Modeling Case Studies: Real Results and ROI
Discover real-world marketing mix modeling case studies. See how brands increased ROI by 30%+ using modern MMM to optimize budget allocation and cut waste.
"Half the money I spend on advertising is wasted; the trouble is I don't know which half."
John Wanamaker said that over a century ago. It’s embarrassing that for many marketers, it’s still true today.
You have dashboards. You have Google Analytics. You have platform-reported ROAS. Yet, when you sum up the conversions claimed by Facebook, Google, and TikTok, the number is often double your actual sales.
The math doesn’t add up.
This is where Marketing Mix Modeling (MMM) enters the chat. It doesn't care about cookies. It doesn't care about pixels. It uses advanced statistics to find the truth.
But theory is boring. You want proof.
Below, we break down three distinct marketing mix modeling case studies. These aren't hypothetical scenarios. They are composites of real-world situations we see in the market, illustrating how smart brands turn failing campaigns into revenue engines.
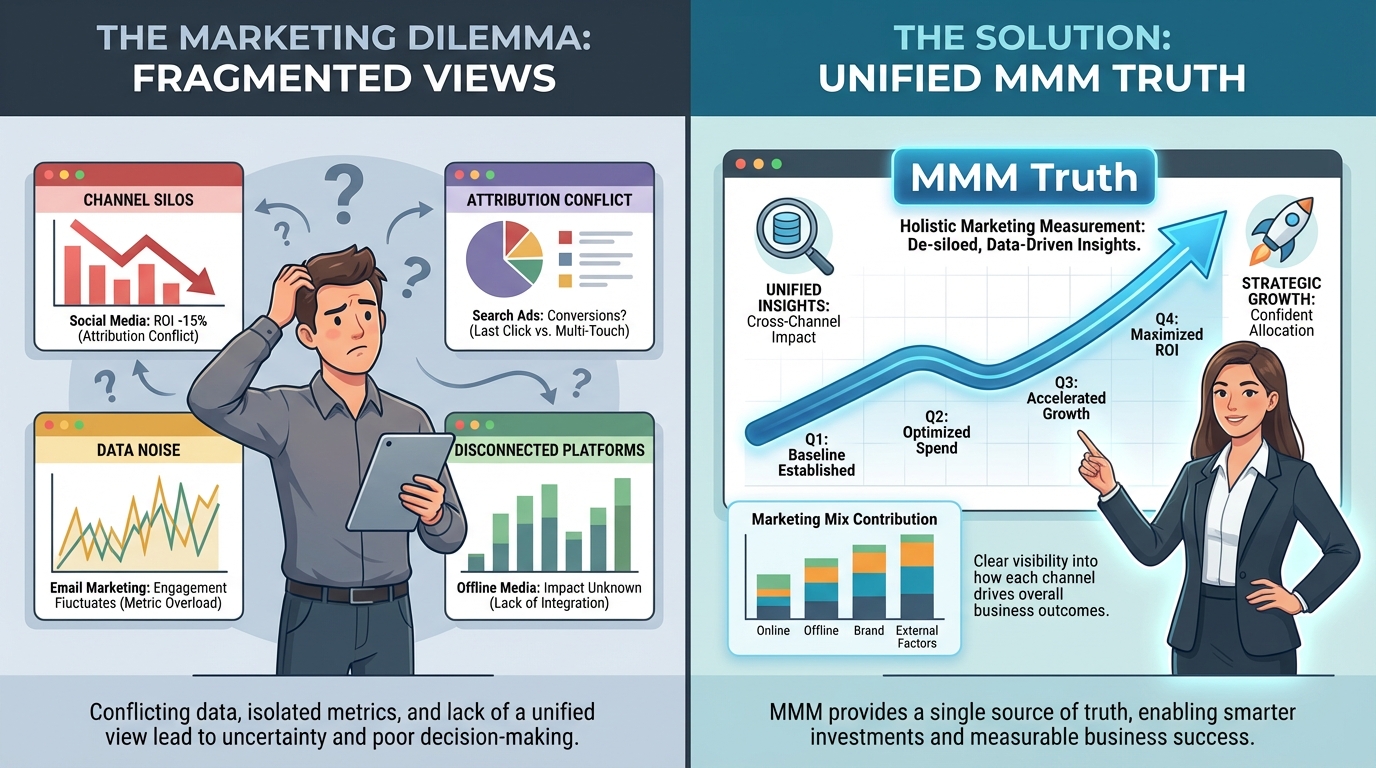
!Comparison of confused multi-touch attribution versus clear marketing mix modeling data.*
Why Marketing Mix Modeling Case Studies Matter
Before we dive into the examples, let’s set the stage.
For the last decade, Multi-Touch Attribution (MTA) was the king. It tracked every click. But privacy changes—specifically Apple’s iOS 14 update and the deprecation of third-party cookies—killed its accuracy. According to Harvard Business Review, the loss of granular tracking data has forced a return to probabilistic measurement.
Marketers are now flying blind. Relying on click-based tracking in a privacy-first world is financial suicide. A recent report by Statista highlights that over 40% of users now opt out of tracking, leaving massive gaps in your data.
MMM restores sight. It analyzes historical data to determine how different marketing channels contribute to sales. It accounts for seasonality, price changes, and even the weather.
If you are still debating the MTA vs MMM marketing attribution comparison, the industry has already moved on. The winners are using MMM because it respects user privacy while delivering actionable insights.
These case studies highlight three specific wins:
- The False Positive: Identifying channels that claim credit but don't deliver.
- The Invisible Hand: Measuring offline and brand channels that digital tools miss.
- The Budget Shift: Moving money to where it actually generates profit.
Let’s look at the numbers.
Case Study 1: The E-commerce Scale-Up (DTC)
The Company: A direct-to-consumer apparel brand generating $20M in annual revenue.
The Problem: The "Scale Wall."
The brand was spending heavily on Meta (Facebook/Instagram) and TikTok. Their platform dashboards looked amazing. Meta reported a ROAS (Return on Ad Spend) of 4.0. TikTok reported a 3.5.
However, the company’s bank account told a different story. Overall revenue was flat, despite a 50% increase in ad spend. The marketing ROI analysis based on platform data was a lie. They were scaling spend, but not scaling the business.
The Analysis
The brand implemented a modern MMM solution. They fed two years of data into the model:
- Daily ad spend by channel.
- Daily revenue.
- Email sends.
- Promotions and discounts.
- Competitor price moves.
The model revealed a metric called "Incremental Lift." This measures how many sales would have happened without the ads. This is a critical distinction that Nielsen often cites as the primary driver of wasted ad spend—paying for customers you already have.
The Findings:
- Branded Search was over-credited. Google Ads claimed credit for customers who were already searching for the brand name. They would have bought anyway.
- Meta was saturated. Spending more wasn't bringing new customers; it was just hitting the same people more often.
- YouTube was undervalued. Last-click attribution showed YouTube had zero ROI. The MMM showed it was a primary driver of initial awareness.
The Action Plan
The brand stopped trusting platform-reported numbers blindly. They used the model to reallocate the budget based on the media mix model marketing attribution guide.
- Cut Branded Search: Reduced spend by 60%.
- Cap Meta Spend: Maintained spend at the point of diminishing returns to maximize ad spend efficiency.
- Scale YouTube: Tripled the budget for top-of-funnel video.
The Results
Within one quarter, the results were undeniable:
- Total Ad Spend: Decreased by 15%.
- Total Revenue: Increased by 22%.
- Profitability: Rose by 35%.
By understanding incremental lift, they stopped burning cash on ads that didn't drive real growth.
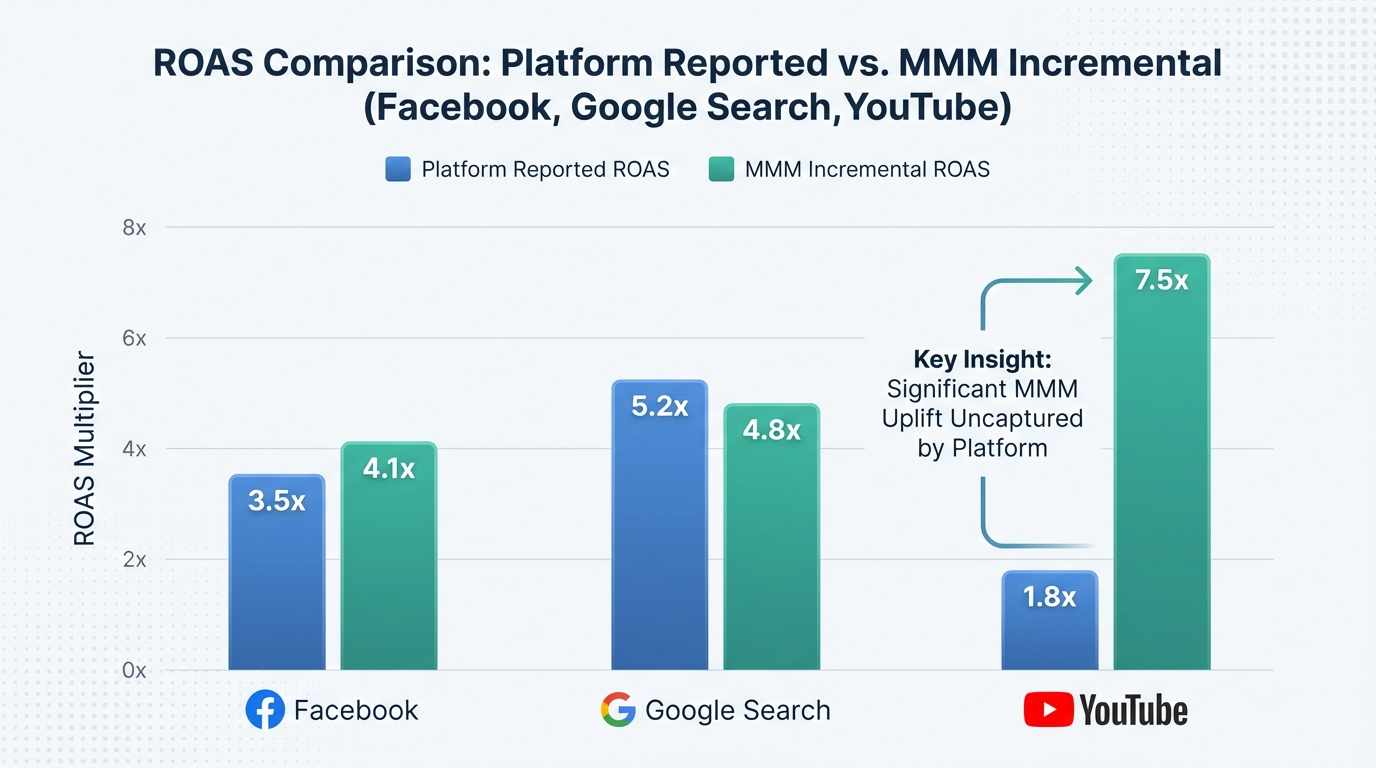
[IMAGE: Bar chart comparing 'Platform Reported ROAS' vs 'MMM Incremental ROAS' for Facebook, Google Search, and YouTube. YouTube's MMM bar is much higher than its platform bar.]
Alt text: Chart showing the discrepancy between platform metrics and actual incremental lift in marketing mix modeling case studies.
Caption: Platforms often underreport top-of-funnel impact while over-reporting retargeting.
The Company: A B2B software provider with a 6-month sales cycle.
The Problem: The "Last-Click Trap."
B2B marketing is complex. A buyer might see a LinkedIn post in January, download a whitepaper in March, attend a webinar in April, and buy in June. This complex journey makes account-based marketing attribution incredibly difficult with standard tools.
The company’s attribution software gave 100% of the credit to "Direct Traffic" or "Organic Search" because that’s how the lead finally signed up. The marketing team couldn't justify the budget for LinkedIn Ads or podcasts because they showed no direct conversions.
According to Forrester, B2B marketers often struggle because they try to apply B2C measurement tactics to long-cycle sales. They prioritize volume over value.
The Analysis
The company used MMM to correlate marketing activities with "Pipeline Created" and "Closed Won Deals" rather than just website visits.
Because B2B data is often thinner (fewer transactions than e-commerce), they used a model that incorporated longer lag times (adstock). They needed to see how spend in January affected revenue in June.
The Findings:
- Podcasts drove intent. Weeks with podcast sponsorships saw a spike in organic search volume for the brand name.
- LinkedIn Ads worked early. High spend on LinkedIn correlated with increased pipeline velocity three months later.
- Events were inconsistent. Large trade shows had a massive cost but showed very little correlation with incremental pipeline generation.
The Action Plan
They moved away from lead-gen forms and focused on demand generation.
- Kill the Trade Shows: They cut the two most expensive conferences.
- Invest in Content: Shifted budget to podcasting and LinkedIn video.
- Optimize for Pipeline: Adjusted the model to optimize for funnel stage budget allocation.
The Results
- Marketing-Originated Revenue: Up 40% year-over-year.
Customer Acquisition Cost (CAC): Went down* by 20% because the leads were higher quality and closed faster.
This proves that marketing effectiveness measurement isn't just about counting clicks. It's about understanding the long game.
Case Study 3: The Hybrid Retailer (Omnichannel)
The Company: A beverage brand selling online and in big-box retailers (Walmart, Target).
The Problem: The "Offline Black Hole."
This brand spent heavily on Out-of-Home (OOH) advertising—billboards, bus stops, and subway ads. They also ran TV commercials.
Digital tools like Google Analytics are useless here. They cannot track a person seeing a billboard and then buying a drink at a 7-Eleven. The CMO was under pressure to cut "unmeasurable" spend and move everything to digital. This is a common struggle; Gartner reports that CMOs are under increasing pressure to prove the ROI of every dollar.
Furthermore, ignoring offline channels is dangerous. Research by WARC indicates that OOH advertising significantly amplifies online search and social media effectiveness.
The Analysis
This is a classic setup for marketing mix modeling case studies. MMM thrives here because it doesn't need user-level tracking. It looks at regional data.
They ran a Geo-Lift test combined with MMM. They saturated specific cities with OOH ads while keeping other cities "dark" (no ads).
The Findings:
- OOH drove search. In cities with billboards, branded Google searches spiked by 18%.
- TV had a halo effect. When TV ads ran, the conversion rate of Facebook ads improved. The TV spots made the digital ads more effective.
- Digital was cannibalizing retail. Aggressive online discounts were actually hurting their retail margins without increasing total consumption.
The Action Plan
The brand realized that cutting offline spend would be a disaster.
- Integrate OOH Tracking: They used the model to score out of home advertising tracking.
- Synchronize TV and Social: They timed their heavy digital pushes to coincide with TV flighting.
- Reduce Online Promos: They pulled back on DTC discounts to protect retail relationships.
The Results
- Retail Sales Velocity: Increased 12% in targeted regions.
- Total Brand Efficiency: Blended ROAS improved by 25%.
- Strategy Validation: The CMO secured budget approval for the next fiscal year.
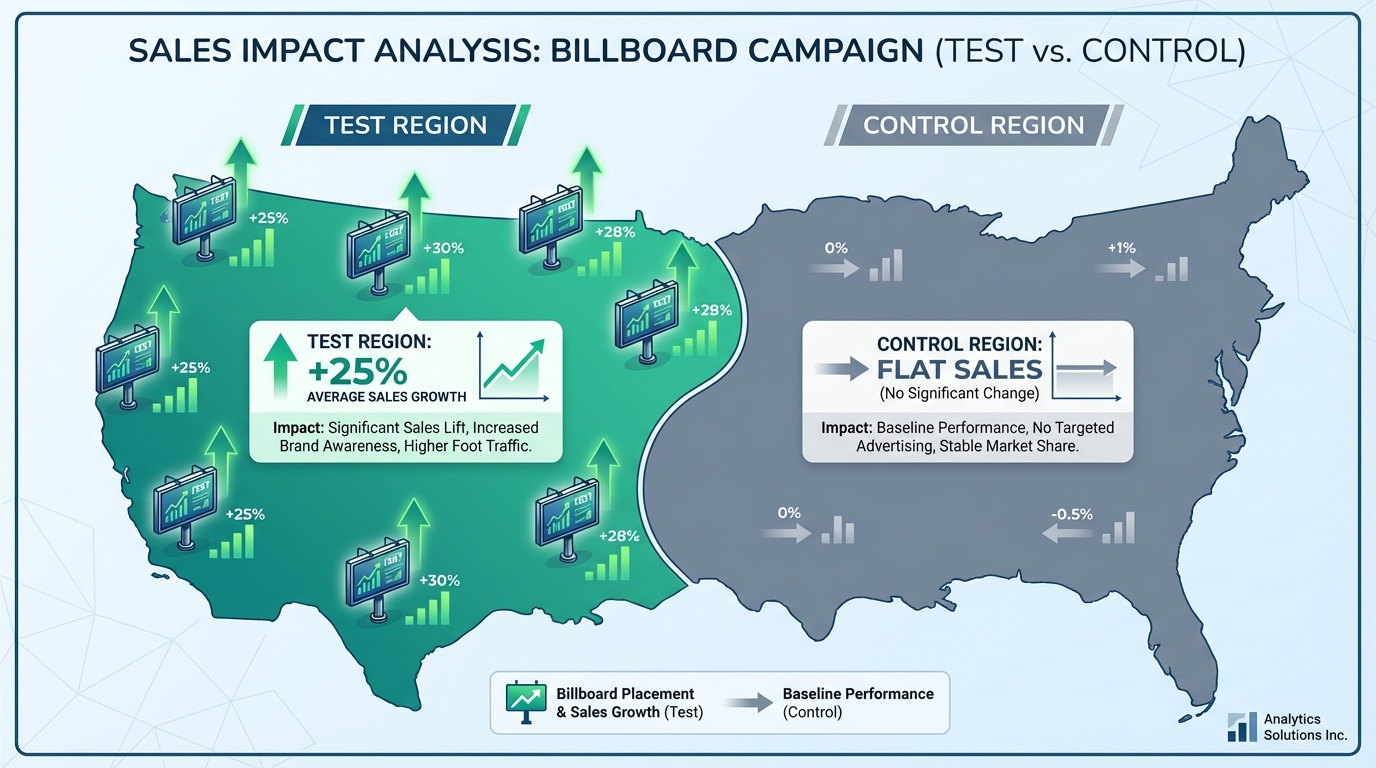
[IMAGE: A map visualization showing 'Test' vs 'Control' regions. Test regions have billboard icons and green upward arrows for sales. Control regions are flat.]
Alt text: Geo-lift testing visualization for out-of-home advertising measurement.
Caption: Geo-lift tests provide the raw data needed to calibrate marketing mix models for offline channels.
Suggested dimensions: 1200x675px
!Geo-lift testing visualization for out-of-home advertising measurement.*
When you rely on last-click attribution, you naturally drift toward bottom-of-funnel channels. You spend more on Retargeting and Branded Search because those channels "claim" the conversion.
This creates a feedback loop. You stop feeding the top of the funnel (Brand Awareness), and eventually, your retargeting pool dries up. Your CAC spikes. You panic.
According to Bain & Company, billions of dollars in digital advertising spend are wasted annually due to flawed measurement and fraud.
MMM breaks this cycle. It allows you to invest in growth channels without fear.
By implementing media budget optimization, you ensure that every dollar has a purpose. You aren't guessing; you are engineering your growth.
Common Threads: What Winners Do Differently
Looking across these MMM examples, successful brands share common traits. They don't just "buy a tool." They change how they operate.
1. They Don't Rely on One Source
Smart marketers know that Google Analytics, Facebook Ads Manager, and Shopify will never agree. They use MMM as the "judge" to settle the dispute. A study by McKinsey found that companies that integrate advanced analytics contribute to a 5-10% increase in profit margins compared to peers who rely on basic attribution.
2. They Test Aggressively
MMM works best when you feed it variance. If you always spend $10,000 every month on every channel, the model struggles to learn. You need to spike spend and cut spend.
This requires bravery. You have to be willing to "go dark" on a channel for a week to measure the impact. This is essential for understanding how to deploy a media mix model effectively.
3. They Value the "Unmeasurable"
Influencer marketing is notoriously hard to track. Codes get leaked, links don't get clicked. But MMM can see the revenue spike when an influencer posts. Brands using influencer marketing performance measurement via MMM often find it performs 2x better than click-tracking suggests.
They use data-driven marketing decisions to guide strategy, rather than gut feelings or vendor dashboards.
The Tech Stack: Excel vs. AI
In the past, MMM was expensive. You hired a consultancy, paid $100,000, and waited three months for a PowerPoint deck. By the time you got the results, the market had changed.
Today, you have options ranging from open-source code to automated AI.
The Open Source Route
Tech-savvy teams might try Google’s Meridian or Meta’s Robyn. These are powerful libraries.
- Read our Google Meridian MMM complete guide.
- Check out the Meta Robyn open source MMM guide.
The downside? You need data scientists and Python engineers to run them. The "free" software becomes expensive when you factor in salaries and maintenance.
The AI Platform Route
Most modern brands prefer dedicated platforms that automate the data ingestion and modeling. This allows for "Always-On" MMM, where the model updates weekly.
BlueAlpha has emerged as a leader here. Unlike legacy solutions that take months to calibrate, BlueAlpha uses advanced AI to automate the regression analysis, delivering actionable insights in days. Clients typically report 20-30% faster time-to-insight compared to building in-house solutions. It offers enterprise-grade predictive analytics without the enterprise price tag.
If you are currently using a simple dashboard tool, you might be outgrowing it.
- See Triple Whale alternatives for better modeling.
- Check Northbeam alternatives if you need more than just attribution.
Implementing Your Own Strategy
You’ve read the marketing mix modeling case studies. You see the ROI. How do you start?
Step 1: Audit Your Data
Garbage in, garbage out. Ensure your historical spend and revenue data is clean. You usually need 12-24 months of history.
Step 2: Choose Your Methodology
Are you building in-house or buying a solution? If you want speed and accuracy without the coding, platforms like BlueAlpha are the standard choice. You can compare options in our Lifesight vs BlueAlpha AI comparison guide.
Step 3: Run a Pilot
Don't try to model everything at once. Start with your top 5 channels. Learn which MMM is best for your specific business model before scaling.
Step 4: Calibrate
Use lift tests (like the geo-lift example above) to check the model's work. If the model says TV drives 100 sales, turn off TV for a week and see if sales drop by 100.
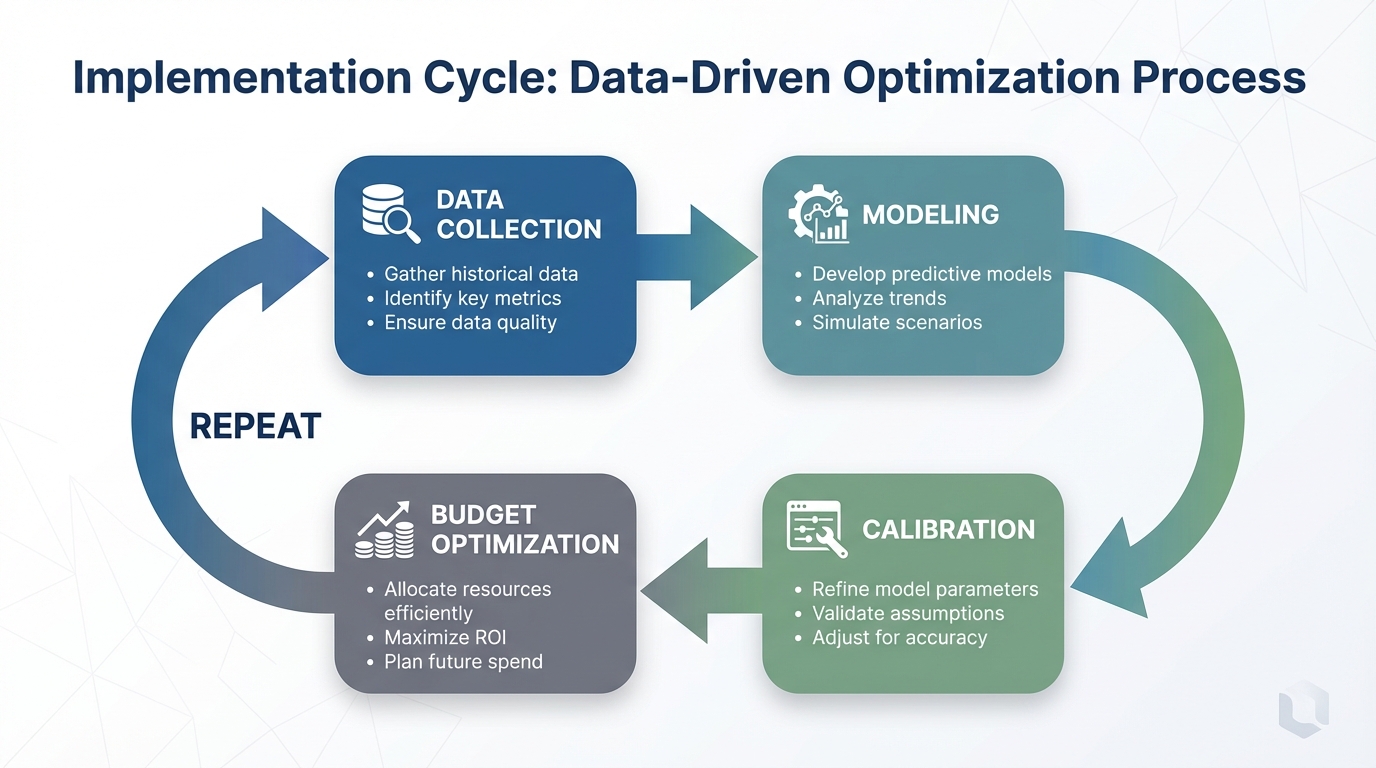
[IMAGE: A flowchart showing the implementation cycle: Data Collection -> Modeling -> Calibration -> Budget Optimization -> Repeat.]
Alt text: The cyclical process of implementing and refining a marketing mix model.
Caption: MMM is not a one-time project. It is a continuous cycle of testing and optimization.
Suggested dimensions: 1200x675px
Frequently Asked Questions
!The cyclical process of implementing and refining a marketing mix model.*
Is MMM better than Multi-Touch Attribution (MTA)?
They serve different purposes, but MMM is generally more robust for strategic planning and privacy compliance. MTA is failing due to cookie restrictions. For a deep dive, read our Which MMM is best article.
Can MMM track brand awareness?
Yes. MMM is excellent at quantifying the impact of brand-building activities (TV, Billboards, PR) on long-term sales, which click-based tools usually miss.
Do I need a data scientist to run MMM?
Not anymore. While open-source tools require coding, platforms like BlueAlpha use AI to automate the heavy lifting, making MMM accessible to marketing managers.
How does MMM handle external factors?
Good models account for "covariates" like inflation, competitor pricing, and seasonality. This ensures that a sales spike during Black Friday isn't falsely attributed to your Facebook ads.
Conclusion
The era of "guessing" is over. The era of blindly trusting Facebook's ROAS report is over.
The marketing mix modeling case studies above prove that accuracy leads to efficiency. Whether you are a DTC brand hitting a ceiling, a B2B company dealing with long sales cycles, or a retailer bridging the online-offline gap, the solution is the same: better math.
You don't need to be a statistician to benefit from this. You just need the willingness to look past the vanity metrics and find the truth in your data.
Ready to stop wasting that "unknown half" of your budget?
Explore how BlueAlpha can automate your marketing measurement today and turn your data into profit.