Marketing Mix Modeling Data Requirements: The Checklist
Stop guessing. Here is the definitive checklist of marketing mix modeling data requirements to build accurate models, clean inputs, and maximize your ROI.
You can build the most sophisticated algorithm in the world. But if you feed it scraps, it starves.
This is the harsh reality of marketing mix modeling data requirements. The math is important, but the fuel—your data—is critical. Most marketing teams fail at MMM not because they lack statistical knowledge, but because their data infrastructure is a mess. They miss historical context, ignore external variables, or aggregate data so aggressively that the signal gets lost in the noise.
If you are preparing to build a model, or if your current model is spitting out results that don't pass the smell test, look at your inputs first.
This guide covers the specific marketing mix modeling data requirements you need to satisfy to build a model that actually works. We aren't talking about high-level concepts here. This is the raw checklist of what you need to export, clean, and ingest.
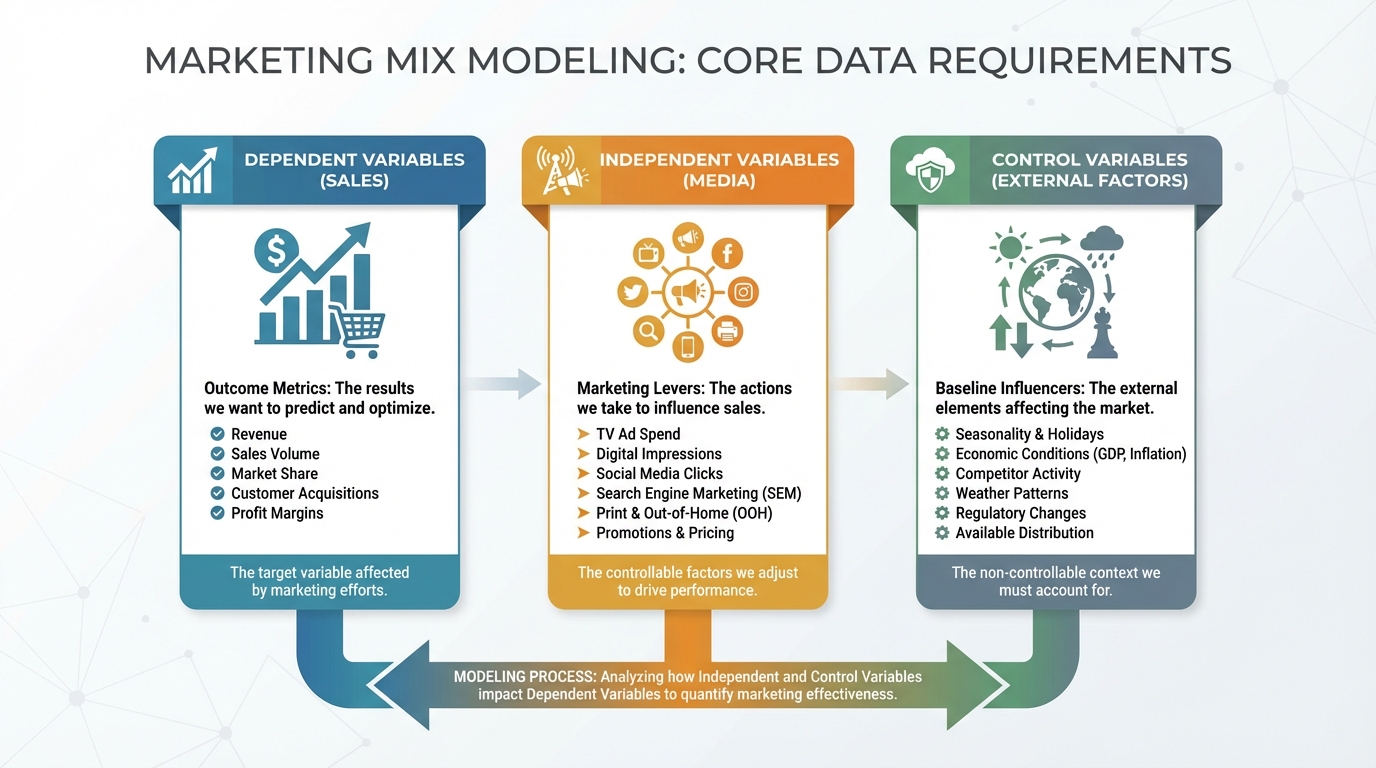
The Three Pillars of MMM Data
Before we open the spreadsheets, you need to understand the structure. MMM data falls into three distinct buckets.
- Dependent Variable (KPIs): What you want to explain (Sales, Revenue, Conversions).
- Independent Variables (Media): What you did to influence the KPI (Spend, Impressions, Clicks).
- Control Variables (Context): What happened outside your control (Seasonality, Economy, Competitors).
If you miss one of these pillars, your model breaks. Leave out the control variables, and your model might attribute a holiday sales spike to a Facebook ad campaign. That leads to wasted budget and inflated egos.
According to Harvard Business Review, treating data as a strategic asset rather than a byproduct is the single biggest differentiator for high-performing marketing teams.
To truly understand how these variables interact to prove value, you should review our marketing effectiveness measurement guide. It sets the stage for why data precision matters.
1. The Dependent Variable: Defining Success
This is your "Y" variable. It is the target.
Most brands default to "Total Revenue." That works for simple businesses. But if you have a complex funnel, you might need to model against leads, app installs, or qualified opportunities.
The Checklist for KPI Data:
- Metric: Revenue, Units Sold, Leads, or Conversions.
- Granularity: Daily or Weekly. (Daily is preferred for digital-heavy brands).
- Segmentation: By product line, geography (State/DMA), or customer type (New vs. Returning).
- History: Minimum 2 years (104 weeks). Ideally 3 years to capture long-term trends.
Warning: Do not mix your metrics. If you model revenue, ensure it is recognized revenue, not just booked revenue, especially if you have a long sales cycle. For a deeper dive on calculating the financial impact using historical sales data, check out our marketing ROI analysis guide.
2. Independent Variables: Media Activity
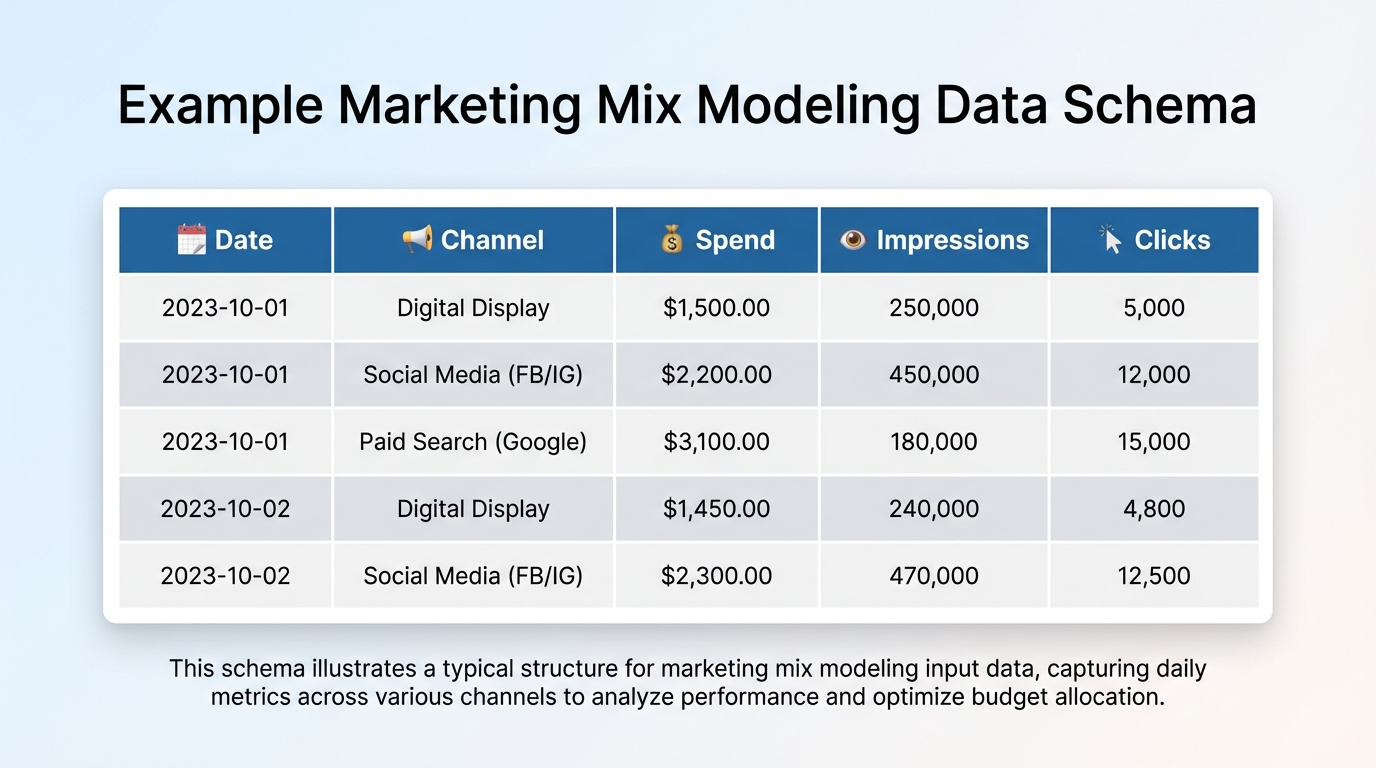
This is the "Mix" in Marketing Mix Modeling. You need granular media spend data on every dollar spent and every eyeball reached.
The biggest mistake here is relying solely on spend. Spend tells you what it cost, but impressions tell you how loud you shouted. CPMs fluctuate. If your spend stayed flat but your impressions doubled, your model needs to know that.
Digital Media Data
For platforms like Meta, Google, TikTok, and LinkedIn, you need:
- Date: Daily.
- Channel/Platform: e.g., Facebook, Google Search, YouTube.
- Campaign Type: e.g., Prospecting vs. Retargeting, Brand vs. Non-Brand.
- Metrics: Spend, Impressions, Clicks.
- Video Metrics: Completed views (optional but helpful).
Standardization is key here. As noted by the Interactive Advertising Bureau (IAB), consistent measurement standards across digital channels are prerequisite for any valid cross-channel comparison.
If you are using modern open-source tools, you might want to look at how different frameworks handle this data. For instance, our Meta Robyn open source MMM guide explains how their library specifically ingests digital variables.
Offline Media Data
Offline is harder to track but essential. You cannot ignore TV just because it doesn't offer a click-through rate.
- Linear TV: GRPs (Gross Rating Points), Spend, Reach.
- Direct Mail: Volume sent, Drop dates, Cost.
- OOH (Billboards/Transit): Estimated daily impressions, flight dates.
For specific instructions on handling billboard data, read our out-of-home advertising tracking guide. It details how to estimate impressions when exact digital logs aren't available.
The "Organic" Component
Don't forget the marketing you don't pay for directly.
- Email Marketing: Sent volume, Opens, Clicks.
- Organic Social: Post volume, Reach.
- SEO: Organic search clicks (from Google Search Console).
Ignoring organic channels forces the model to attribute organic sales to paid channels, artificially inflating your paid media ROAS.
3. Control Variables: The Context
This is where good models become great models.
If you sell umbrellas, rain drives sales. If you don't include weather data, your model will think your billboard caused the sales spike during the storm. Control variables isolate the "baseline" sales—the sales you would get if you spent zero dollars on marketing. This is one of the most vital marketing mix modeling data requirements.
Essential Control Data:
- Seasonality: Holidays (Black Friday, Christmas), School start dates.
- Pricing: Average Selling Price (ASP), Discount depth (%).
- Distribution: Number of stores carrying your product (for retail brands).
- Macroeconomics: Unemployment rate, Consumer Confidence Index (CCI), Inflation rate.
- Competitor Activity: Share of Voice (SOV) or estimated competitor spend (if available).
According to Gartner, failing to account for external factors is a leading cause of model inaccuracy in retail sectors. Including external factors in MMM prevents false attribution.
If you are struggling to decide which model structure handles these variables best, compare your options in our media mix modeling comparison.
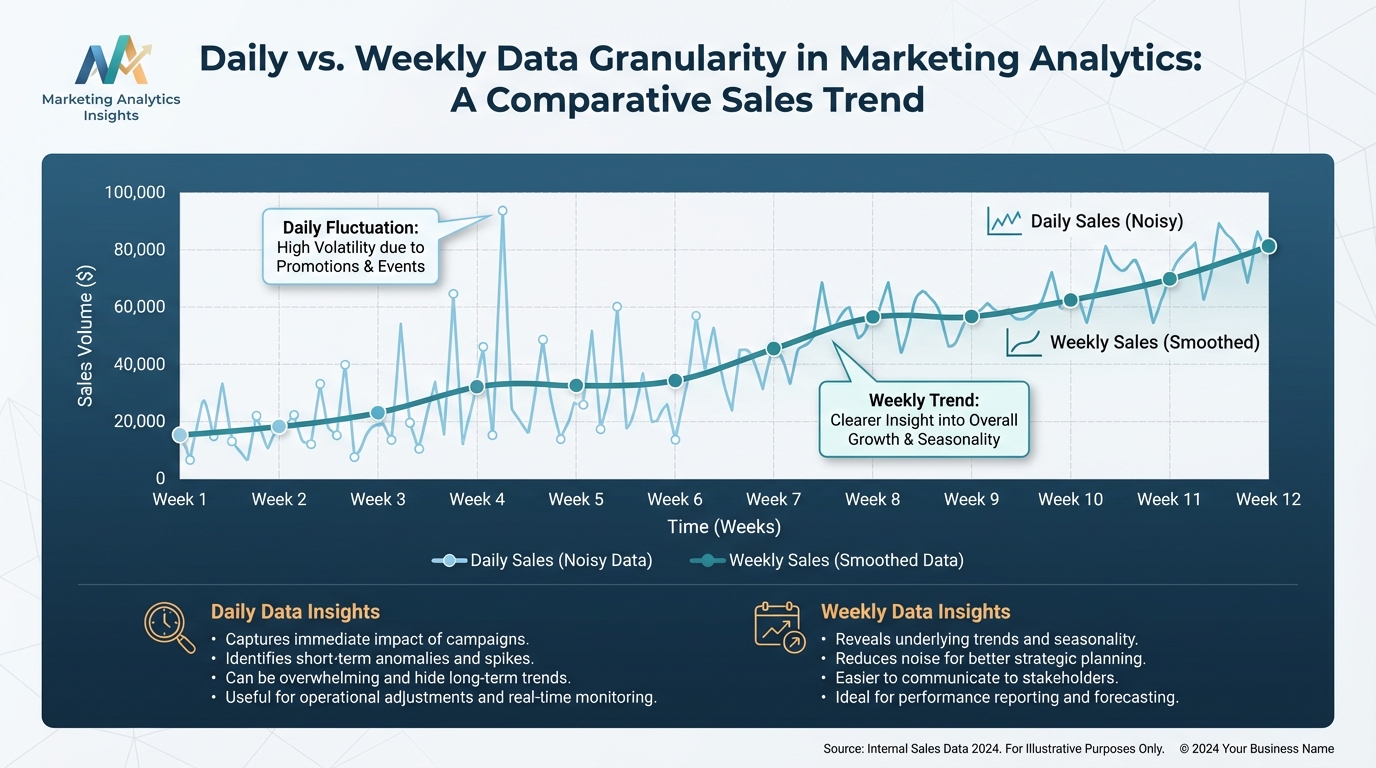
Granularity: Daily vs. Weekly Data
One of the most common questions regarding marketing mix modeling data requirements is about time. Should you aggregate by week or by day?
The Weekly Argument
Traditional MMMs (built by legacy agencies) use weekly data.
- Pros: Smoothes out noise; aligns with weekly purchase cycles.
- Cons: Loses nuance. If you run a TV spot on Friday and sales spike Saturday, weekly data lumps them together, making causality harder to prove.
The Daily Argument
Modern AI-driven platforms (like BlueAlpha) often prefer daily data.
- Pros: Higher sample size (365 points per year vs. 52); captures immediate response to digital ads.
- Cons: Data can be noisy; requires cleaner inputs.
Research from Nielsen suggests that granular data inputs significantly improve the model's ability to detect short-term sales lifts from digital channels.
For a detailed walkthrough on setting up your model's timeline, refer to our guide on how to deploy a media mix model.
Historical Depth: How Far Back?
You need enough history to establish a pattern.
- Minimum: 2 years. This allows the model to see seasonality twice. It learns that "December is always high," so it doesn't attribute the Christmas bump solely to your December ad spend.
- Ideal: 3 years. This helps account for anomalies (like a pandemic year or a supply chain crisis).
You can source reliable economic data for these periods from the Federal Reserve Economic Data (FRED) database to use as control variables.
If you are a startup with only 9 months of data, MMM is difficult. You might rely more on attribution tools initially. However, as you scale, the transition is inevitable. See our MTA vs MMM marketing attribution comparison to understand when to switch.
Specific Channel Nuances
Data isn't one-size-fits-all. Different channels require different handling.
Influencer Marketing
Influencer data is notoriously messy. You often have a flat fee for a post that goes live on Tuesday but gets engagement for a week.
- Requirement: Log the cost on the "live date."
- Metric: Track views/reach, not just likes.
- See our influencer marketing performance measurement guide for the exact schema.
B2B and Account-Based Marketing (ABM)
B2B sales cycles are long. The click happens in January; the deal closes in June.
- Requirement: You must lag your media data or model against "Pipeline Created" rather than "Closed Won" revenue initially.
- Metric: Account engagement scores.
- We cover this complexity in our account-based marketing attribution guide.
Data Cleaning: The Unsexy Reality
Before you upload a CSV to BlueAlpha or any other platform, you have to clean it. Dirty data destroys models.
The "Gotcha" List:
- Zeros vs. Nulls: A
0means you spent nothing. ANull(blank) might mean the data is missing. Models treat these differently. - Naming Conventions: "FB_Ads" in January and "Facebook_Ads" in February will be read as two different channels. Standardize your naming.
- Currency: Ensure all spend is converted to a single currency if you operate globally.
- Tax: Decide if you are using Gross Spend or Net Spend. Stick to it.
If you are evaluating tools to help automate this collection, you might look at Funnel.io alternatives for marketing data platforms. Getting the pipes right saves you hours of Excel hell.
Google Meridian and Modern Privacy
With the release of Google's Meridian, the marketing mix modeling data requirements are shifting slightly to include reach and frequency data more explicitly to help calibrate the model. This allows for better understanding of saturation points.
You can read more about the Bayesian priors used in Meridian directly in the Google Developers documentation.
If you are technically inclined and want to use Google's new framework, review our Google Meridian MMM complete guide. It details the specific priors and inputs that Meridian expects.
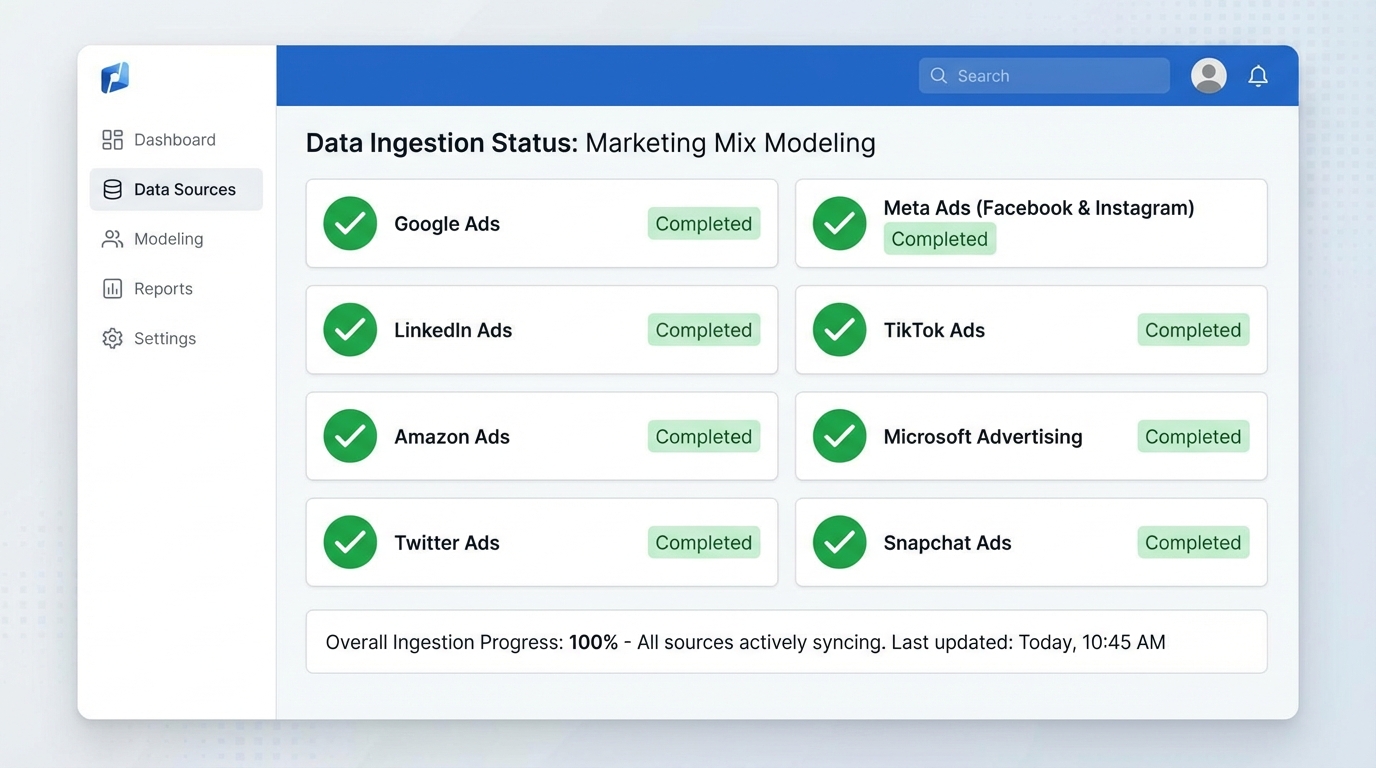
How BlueAlpha Handles Data Ingestion
You can do this manually in Python or R. Or you can use a platform.
BlueAlpha allows you to connect APIs directly. We pull the spend, impressions, and clicks automatically. We map the columns. We handle the currency conversion. BlueAlpha reduces data preparation time by 80% compared to manual aggregation, ensuring your model is always running on fresh data.
However, even with BlueAlpha, you must provide the strategy. You tell the system which campaigns constitute "Brand" vs "Performance." You provide the historical sales file.
For brands comparing us against others, transparency is key. You can see how we stack up in our Measured.com vs BlueAlpha AI comparison or the Recast vs BlueAlpha comparison. We focus on speed to insight without sacrificing data integrity.
The "Cold Start" Problem
What if you don't have perfect data?
Start anyway.
A model built on 80% accurate data is better than making decisions based on 0% data (gut feel).
- Aggregate: If daily data is messy, roll it up to weekly.
- Simplify: If you can't split Facebook into "Prospecting" vs "Retargeting," just model "Total Facebook."
- Iterate: Improve your data hygiene this month so your model is better next month.
Meeting the basic marketing mix modeling data requirements is often enough to get your first directional read on efficiency. This iterative approach is vital for budget management. Read our media budget optimization guide to see how to adjust spend even with imperfect models.
FAQ: Common Data Questions
Q: Do I need customer-level data (PII) for MMM?
A: No. That is the beauty of MMM. It uses aggregate data. You do not need cookies, device IDs, or user-level tracking. This makes MMM future-proof against privacy changes. Forrester highlights this aggregate approach as a key advantage in a privacy-first world.
Q: Can I use Google Analytics data for sales?
A: You can, but backend CRM or ERP data is better. Google Analytics often under-reports actual revenue due to ad blockers and tracking failures. Always use the "source of truth" financial data.
Q: How do I handle a rebrand or website migration in the data?
A: This is a "structural break." You create a "dummy variable" (a column of 0s and 1s) to tell the model that a major change occurred on a specific date.
Q: How much does data preparation cost?
A: It costs time. If you use a tool like Lifesight alternatives or BlueAlpha, the ingestion is faster, but your team still needs to validate the numbers.
Q: Can MMM measure brand equity?
A: Indirectly. The "baseline" sales (sales with zero marketing) often represent your brand strength. If your baseline grows year over year, your brand is getting stronger.
Conclusion
The output of your Marketing Mix Model is only as good as the input.
Marketing mix modeling data requirements are strict, but they are manageable. You need accurate Sales data (Dependent), granular Media data (Independent), and robust Context data (Controls).
Don't let the checklist overwhelm you. Start by gathering your historical sales and your top 3 media channels. Clean that up. Then layer in the rest.
The goal isn't a perfect spreadsheet. The goal is a model that tells you where to put your next million dollars.
Ready to stop wrestling with CSVs and start optimizing?
Check out how we automate this process. Or, if you are still shopping around, read our Northbeam vs BlueAlpha AI comparison to see the difference in data handling.
Get your data right. The ROI will follow.